Has the uptrend started? Read today's report to see what are some significant levels to look out for in order to confirm the uptrend.
General overview
Market Cap: $284,394,661,536
24h Vol: $16,128,684,818
BTC Dominance: 45.0%
From yesterday’s level, the evaluation of the cryptocurrency market capitalization has decreased by 4 million dollars which is not that significant. As you can see from the chart below the evaluation has formed a plateau.
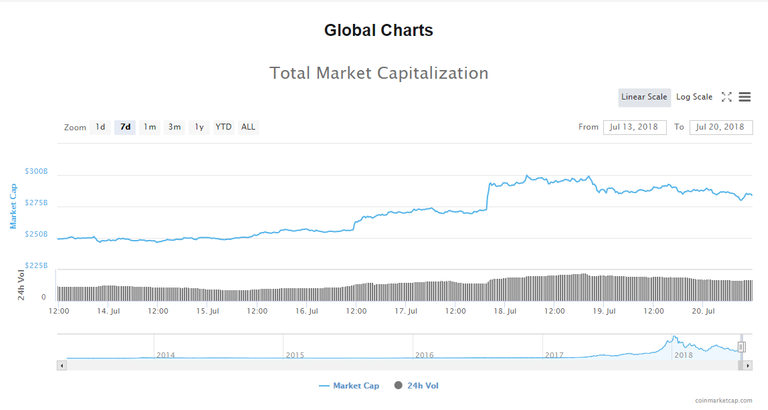
The market is mixed in colors, with an average percentage of change among top ranging from 2-4%.
News
Looking at the headlines that came out in the last 24 hours I see that many are analytical in nature as everyone is now speculating on whether the cryptocurrency market has reached its bottom, because of the rebound that the market has experienced.
Some of the headlines that fit that category are the following:
Bitcoin Rally Converts Staunch Bear, Sees Price Breaking Above US$8,000
Billionaire Investor Says No One Wants to Buy Bitcoin, Market Shows Otherwise
‘I’d Like to See Us Test $5,000’: BitMEX CEO Pragmatic on Bitcoin Price Rise
Bitcoin Price and Seasonality: The Coming Rally?
Analysis
BTC/USD
From yesterday’s open at 7290$ the price of Bitcoin has increased by 2% and is currently sitting around 7467$.
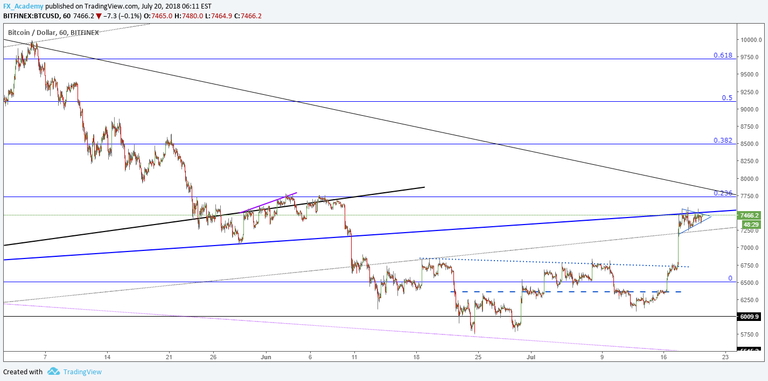
As you can see from the hourly chart the price action is testing the resistance line of the prior triangle support (bold blue line) and has formed a symmetrical triangle around it. The breakout looks near and judging by the steepness of the support line it looks like buyers are more aggressive at the moment which is why a breakout on the upside is more likely, but not by more than 15% likely.
Market sentiment
Hourly chart technicals signal a buy.
Moving averages are signaling a strong buy.
Pivot points
S3 6881.1
S2 7159.7
S1 7316.6
P 7438.3
R1 7595.2
R2 7716.9
R3 7995.5
ETH/USD
From yesterday’s high at 483$ the price of Ethereum has fallen by 4% as its currently sitting at 464$ level.
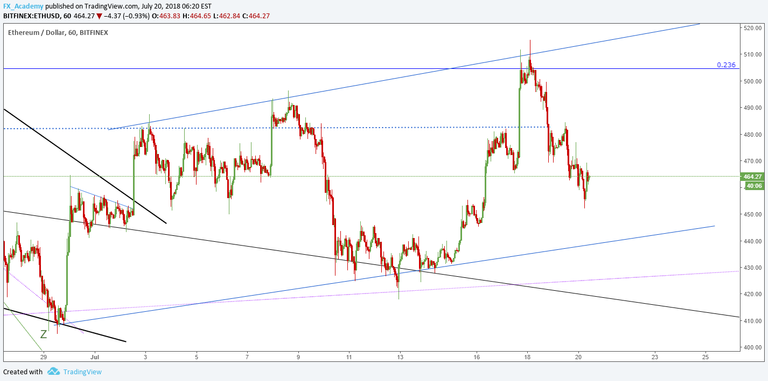
As it can be seen on the hourly chart, the price action is in the channel and currently in the lower midpoints of the channel. As the market is correlated, if the price of Bitcoin goes up so will the price of the Ethereum to the channels resistance line at least.
Market sentiment
Hourly chart signals a sell.
Pivot points
S3 428.44
S2 450.16
S1 459.40
P 471.88
R1 481.12
R2 493.60
R3 515.32
XRP/USD
From yesterday’s open at 0.493$ the price of Ripple fell to 0.448$ level but has recovered since and is currently sitting at 0.462$ which is an overall 6,35% decrease
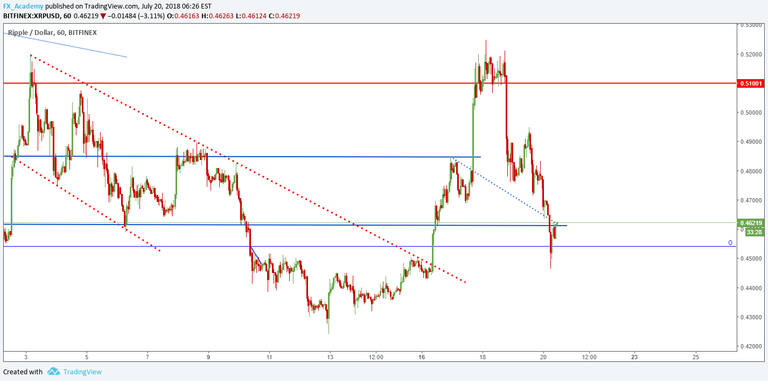
Looking at the hourly chart we can see that the price fell steeply and quickly which indicates that the demand was not that strong, but currently, we are seeing a higher low which is an indicator of a starting uptrend.
Market sentiment
Hourly chart technicals signal a sell.
Pivot points
S3 0.43408
S2 0.45760
S1 0.46732
P 0.48112
R1 0.49084
R2 0.50464
R3 0.52816
Conclusion
Today is a very important day because we will see either a confirmation that the uptrend started or an invalidation, and a shift toward a short-term recovery in a downtrend scenario.
Interesting to see the altcoins underperform Bitcoin by such a large margin. Bitcoin may be seen as the reserve asset to be in before deploying elsewhere.
Yes exactly