Regular daily update on BTC ta analysts opinions.

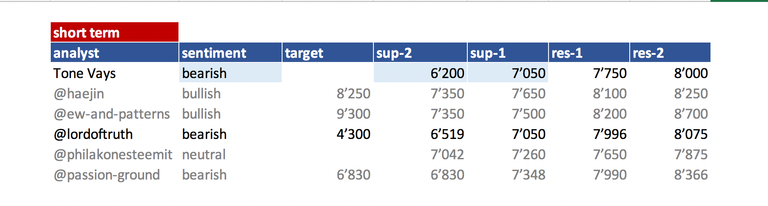
**My summary - short-term sentiment: bearish ** (last: neutral )

We broke down through the 7'350 which fuels the bearish scenario a lot.
Bearish scenario (preferred):
We broke down through the 7'350 which fuels the bearish scenario a lot.
Next level to watch is 7'050. Below 7'000 panic sell is expected.
Bull scenario:
Seems much more unlikely now - we need to break 7'750 - 8'000 to confirm us being in a healthy bull run before any further correction to the downside. That is key in a first step.
Second step - there are several scenarios seeing us turning in the area of 9'000 - 10'000 for significant downside. So we need to break 10'000 in this larger degree move up.
- @haejin: He is posting bitcoin only on bitcoin live anymore. I am trying to reach out to him to see if we can have an abstract here.
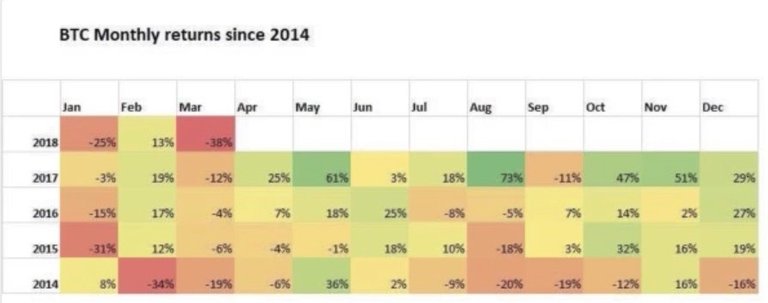
- May is usually a strong month. But not this year. We started at 9'240 and went all the way down to 7'485 (-19%). Lets see how June plays out -usually also a bullish month. Are we going to see a compensation of May with a huge rally up?
News about the blog
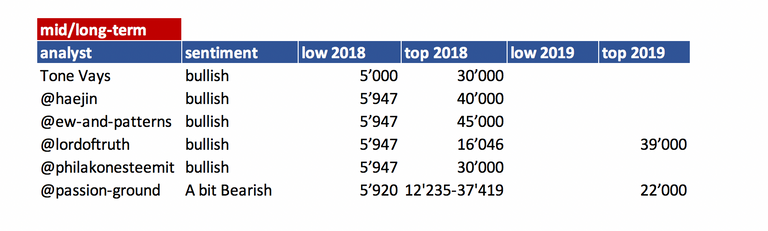
I need to revise my 2018 long term table. I need to add a 2018 and 2019 target an be more precise on the sentiment here. Will do that after I am back in Switzerland.
We lunched the bounty project beta. If you are interested and you like to create a bounty on your own have a look at this post
Analysts key statements:
Tone:
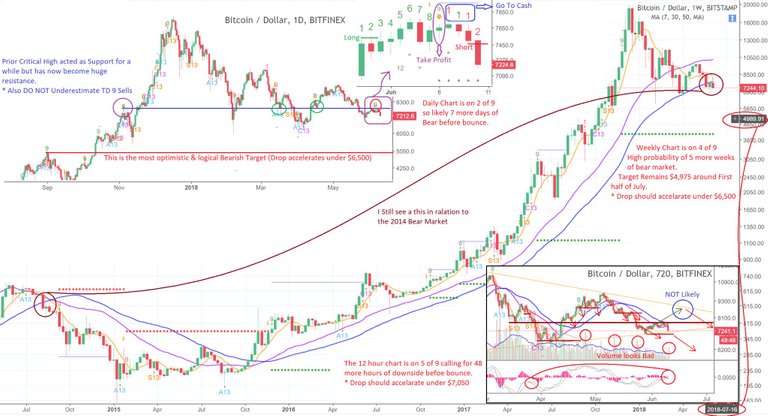
- Weekly: It is very similar to August 2018. Current week is a red one - next would be a flat one according to "script".
- Daily: Volume peaks are on red days - lot of selling pressure. He thinks the scenario to go back up to the top of the triangle becomes unlikely. We are below 30 MA 12hr. He sees no bullish signals anymore and see us going down to 4'975 (prior high in November) until 16th of July.
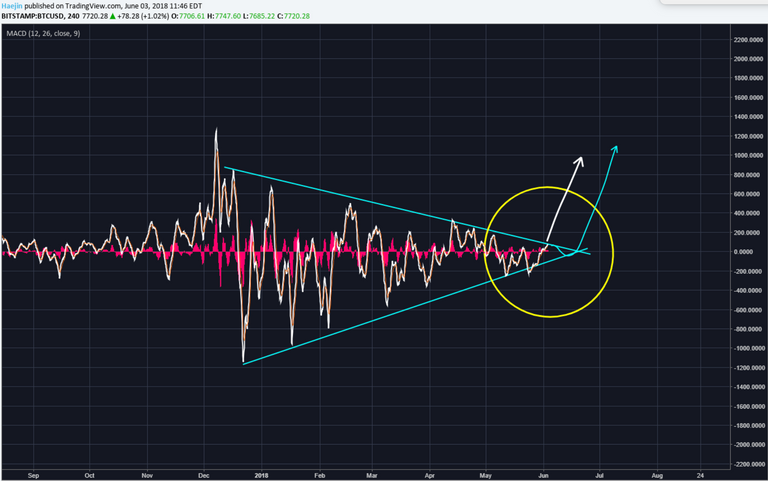
@haejin:
@haejin is moving his analysis to bitcoin live. Those of you who want to follow him directly should look into subscription. I will try to get in contact to see if I can use an abstract to post here also in the future.

Bitcoin did a small surge to decisively breach the Neckline of the Inverted H&S pattern. The target for the minimum run for the IHS is 8'200. However, keep into awareness the upward pointing wedge pattern (blue lines). Price will likely go sideways again for most of the day and if there is one more surge, it will either breach the top blue line and invalidate the wedge pattern or validate and confirm it with a decline.
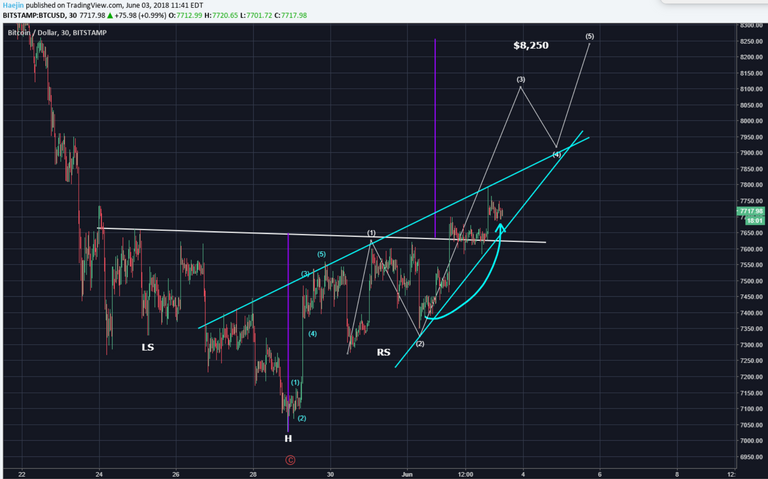
The bull flag pattern is still in progress. Note how the wedge pattern is now sitting just below the belly of the upper white trend line. So, a decision needs to be made. An upside breakout would provide the pathway to the 8'200 target for IHS. However, a downside could jive well with the MACD progression. What does this mean? The next chart clarifies.
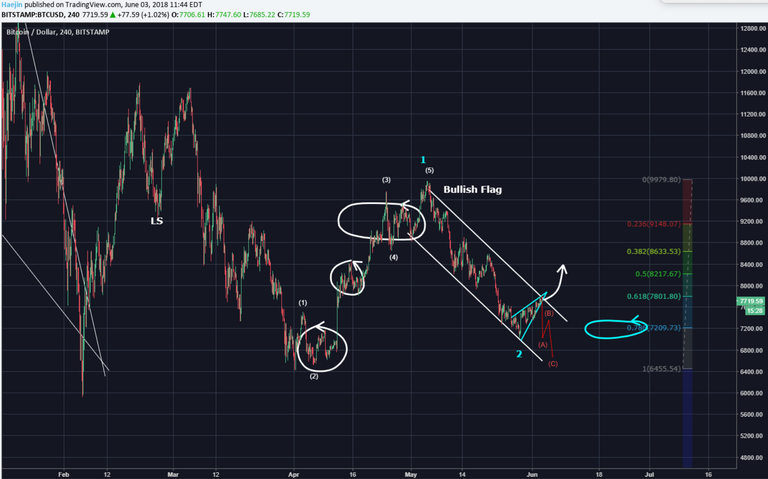
Note how the MACD is at the belly of the upper blue trendline. I believe it could do one more turn down towards the lower blue trendline. This turn in MACD could also mean the 6'700 level or so.
@ew-and-patterns:
It is starting to look better. This might be the start of the next impulse wave. BUT:
Keep in mind that we want to see a decisive break of 10'000, before we can assume a stable uptrend.
This could just be wave e developing right now. If it is wave e, we will see a sharp U-turn in the range of 8'800-10'000. If you see that kind of reversal be in high alert mode.
The problem I see is, that even if it is blue wave 1 developing, it could still reverse in the 8'800-10'000 area and be only blue wave 2.
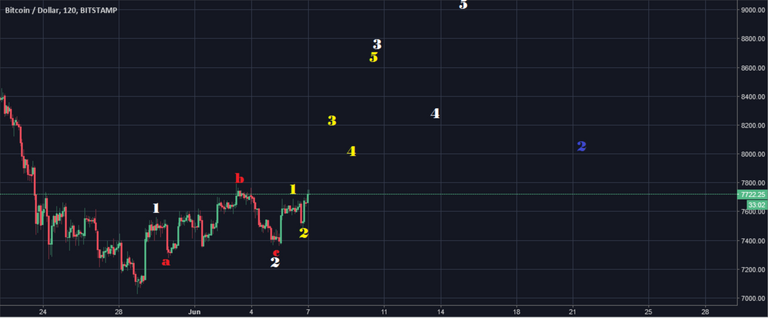
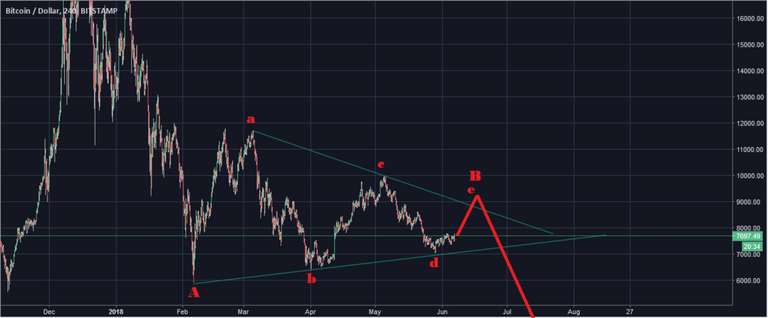
If it is blue wave 1 and wave 2, it will likely reverse to the upside again around 8'000.
We won't know for sure until in a few weeks. Just be aware of the risks. Targets for wave C range from 4'500 -2'400....
Targets for blue wave 1 and 2 range from 12'000 - 17'000.
He will be gone for holidays starting on the 07.06.18 until 14.06.18.
@lordoftruth:
At press time, bitcoin is trading around 7'300 and the chances is valid to achieve more decline, supported by MACD & RSI.
The 2 weekly bearish stop grabbers suggest drop below 6'519, to test 5'878 reaching 4'300 area.
The decline will resume, as long as the price below 7'996 - 8'075 area. So we might see a stronger move to the downside in the next week.
Confirmation of a change in short term bearish trend will be on a breakout and close above 7'996.
Todays trend is bearish. Trading between 7'050 and 7'996.
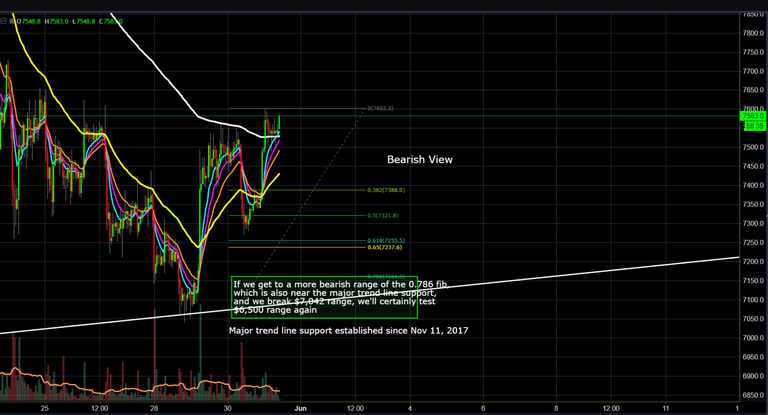
@philakonesteemit:
A bounce at the 7'000 level was much expected due to hitting a major trend line support established since Nov 11, 2017.
Bullish View, if we break the 7'650 range, there's a chance to hit 7'850 to 8'000 range (0.5 to 0.618 fib retracement)
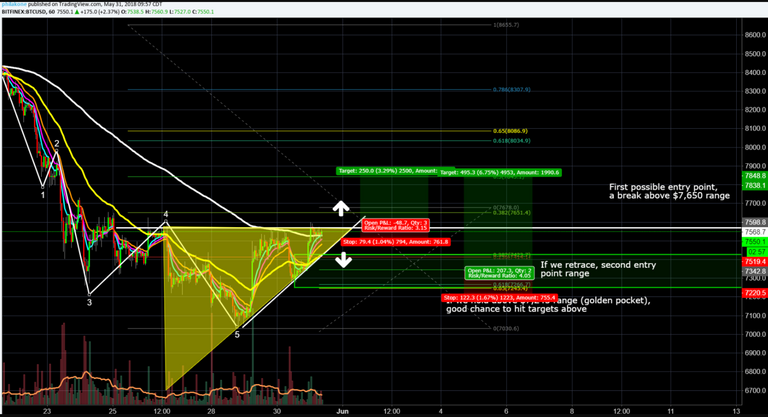
Bearish View, if we break 7'161 range, we'll most likely test 7'040, which I see as failing to hold and then testing 6'500.
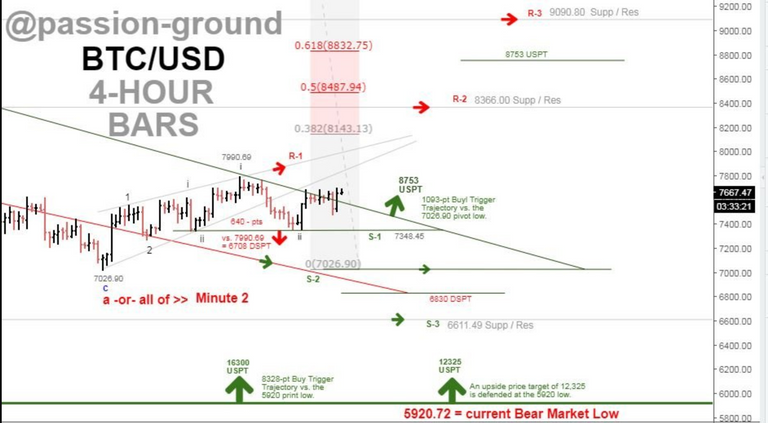
@passion-ground:
BTC must make a print north of 7'990 prior to breaching 7'348 or it’s heading back down.
Though we have thus far held above 7348.25, the move up remains weak and needs to explode to the upside soon for short-term bullish prospects to manifest. See the video for details.
Summary of targets/support/resistance
Reference table
| analyst | latest content date | link to content for details |
|---|---|---|
| Tone Vays | 10. June | here |
| @haejin | 03. June | here |
| @ew-and-patterns | 07. June | here |
| @lordoftruth | 10. June | here |
| @philakonesteemit | 31. May | here |
| @passion-ground | 07. June | here |
Definition
- light blue highlighted = all content that changed since last update.
- sentiment = how in general the analysts see the current situation (bearish = lower prices more likely / bullish = higher prices more likely)
- target = the next (short term) price target an analysts mentions. This might be next day or in a few days. It might be that an analyst is bullish but sees a short term pull-back so giving nevertheless a lower (short term) target.
- support/res(istance) = Most significant support or resistances mentioned by the analysts. If those are breached a significant move to the upside or downside is expected.
- bottom = -> now renamed and moved to long term table. Low 2018
- low/top 2018 = what is the low or the top expected for 2018?
Further links for educational purposes:
- From @ToneVays: Learning trading
- From @philakonecrypto: Like in every post you find links to his amazing educational videos. For example here
- From @lordoftruth: Fibonacci Retracement
- From @haejin: Elliott Wave Counting Tutorial
*If you like me to add other analysts or add information please let me know in the comments.
I get it now, when the price goes down Bearish, when price goes up bullish :)
Makes more sense to me than Clif High ever has :)
Clif high is fucked lol
Do not panic about the drop in Bitcoin's price. It is an overreaction to the news that Bitstamp, Coinbase, itBit and Kraken are being investigated for price manipulation. This will delay the bull market by no more than 30 days. Don't buy into the fear. Buy the coins.
hello sir how can i catch you on discord app i have one offer for you sir ????