Regular daily update on BTC ta analysts opinions.

My summary - short-term (next 24h) sentiment: bullish (last: bullish)

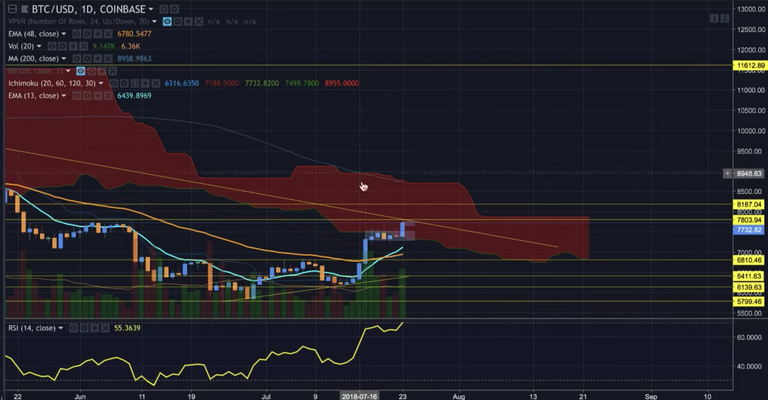
We moved up to 8'000 area
RSI on all timeframes up to daily is at overbought level.
We closed over 7'664 (MA128 daily, November 2017 top) - strong signal and also are above bollinger band mid-line.
Next major resistances 8'280 (MA50 weekly).
It seems in the war of the bears and bulls we are entering another battle: Can the bulls create enough FOMO to create distance to the lows and overcome major resistance levels? If so we are not going to see the current levels for a long time.
Or do the bears lead the bulls into a trap and than smashing hard to the downside. That would create a lot of frustration and might lead to the capitulation which you would expect to be necessary to call the bear market over.
Bull scenario*:
- After completing 5 waves up we reconfirm 7'000+ level in a ABC pull back gathering strength for another move up.
- That confirms a higher low and bullish 5 wave count.
- Alternate: Bull flag is forming - that brings us directly to next resistance level at 8'300 from here.
- Volume needs to increase.
- We overcome the death cross area of the 30/50 week MA and break above it.
Bearish scenario*:
- We move up for one or two weeks into the death cross (30 and 50 MA weekly) at around 8'500 and than drop significantly.
- Alternate - bears are turning after the RSI gets oversold and make a lower low
- After breaking 5'800 a significant drop towards new lows in the range of 4'975 and 4'300.
*scenarios based on daily-candles - so around 4-14 days timeframe. See also definition section
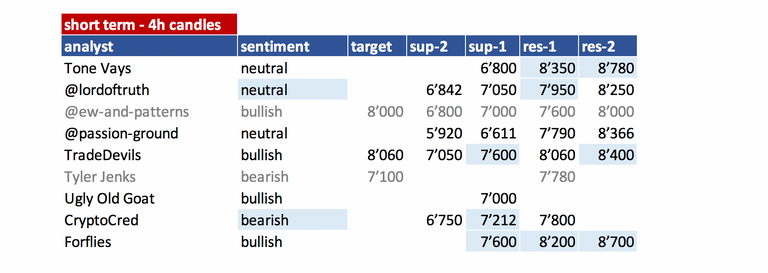
Summary of targets/support/resistance of TAs
Short-term overview
mid- and long-term overview
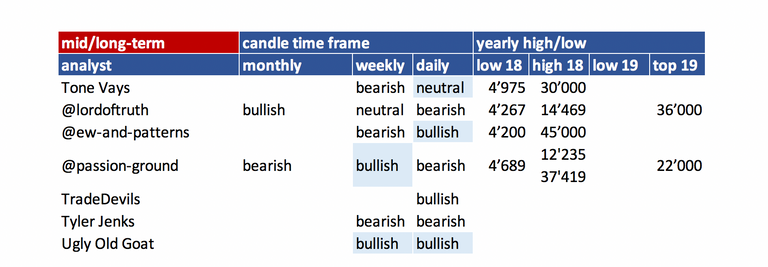
- please refer to definition section for time-horizon.
- be aware that mid- and long-term is mostly my interpretation of what analysts sentiment is as they not always clearly differentiate those time-frames. To interpret that consistently is very hard so please be kind with my interpretation.
- you can easily spot which analyst did an update
(block writing - grey ones don't have an update today).
Their changes are in light blue.
Helpful statistics:
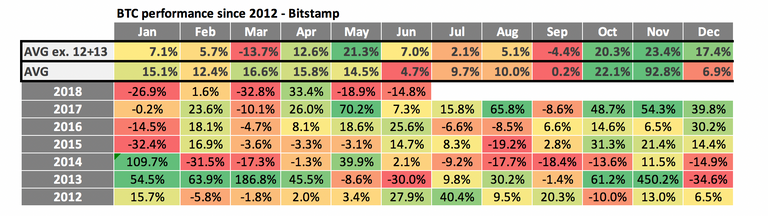
monthly performances
- Added 2012 + 2013 on request.
- As 2012 and 2013 the % move are gigantic I added two averages. One without 2012 + 2013.
- June performance was very weak. With -14.8% clearly below the average of the last years. With 2013 this is the only negative month at all.
- July is a mixed bag - 2 year positive performance and 2 year of negative performance. 2012 and 2013 were positive though.
- The average is positive with 2.1% but that is mainly due to the bull rund 2017. The average incl. 2012and 2013 is even more positive. That is mainly due to the 40%+ spike in 2012 so I wouldn't rely on that.
So just looking at this table we probably facing another negative month.
News about the blog
- I added two analysts
- CryptoCred: Posting target on twitter and has very good educational videos. See Educational links section for them.
- Forflies: I added him not knowing him too well - that is why his logo is in grey box - meaning under evaluation.
Analysts key statements:
Tone (neutral):
Weekly TD gives a bull signal 2 trading above 1. He is not convinced and doesn't recommend to take the bull play.
He sees strong resistance of the 30 MA and 50 MA weekly.
he is 80-90% convinced that the 5'700 area is not the low of the year. A little less certain than the April low not being the low.
Daily is on 8 - 9 coming and probably going to slow down the bullish momentum.
@lordoftruth (neutral):
Bitcoin price has climbed enough to reach the area of interest at 7'950, supported by EMA50 and Stochastic.
RSI reflect a return in selling pressure, and Oscillator turns from the overbought area to reflect bullish exhaustion.
We do not expect extending the rally above 7'950 - 8'000, and most likely this upmove will get end, as 4H Chart that show potential retracement by Butterfly "Sell" Pattern towards 7'050 - 7'100 area.
Todays trend is neutral. Trading between 7'050 and 8'000.
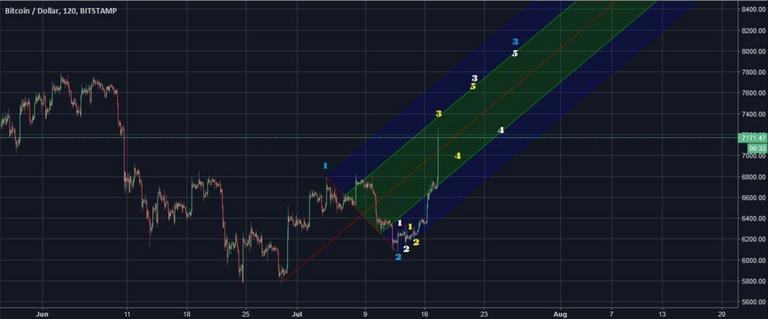
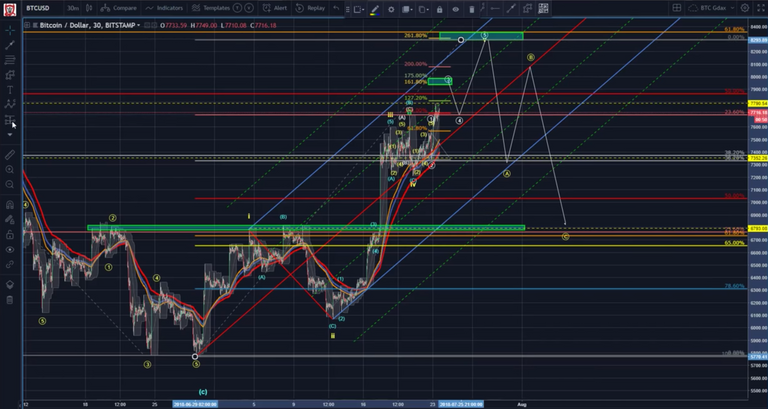
@ew-and-patterns (bullish):

Update:
He was thinking of a move within a triangle but that seems to be off the table.
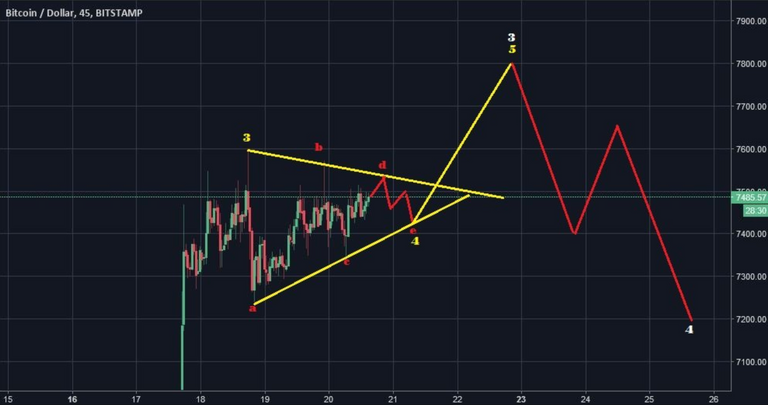
Rather he sees the current move to be either end of white wave 3 or C leg of yellow wave 4.
older news - still valid:
It is too early to call it a bottom, but I want to show you the best case today. Let's say this impulse wave continues past 8'000 and finally past 10'000...
If so, this is the most probable best case.
It would form a cup pattern, possibly with a handle afterwards.
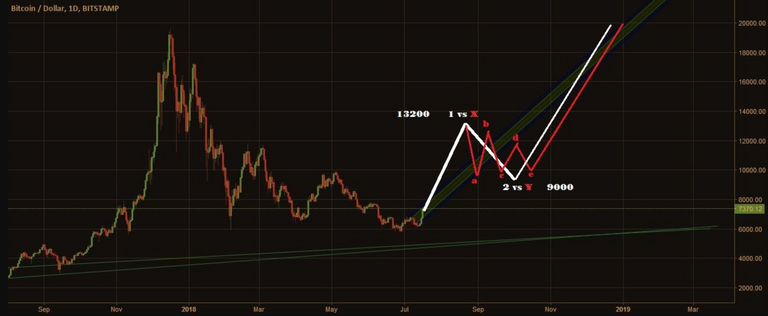
This move could bring BTC up to 13'200 for wave 1 or X. If it's wave 1, we will likely see any other correction but not a triangle. If it is wave X though, a triangle is very likely due to the rule of pattern alternation. We would have a ZigZag for W, an expanded flat for X and a triangle for wave Y (red).
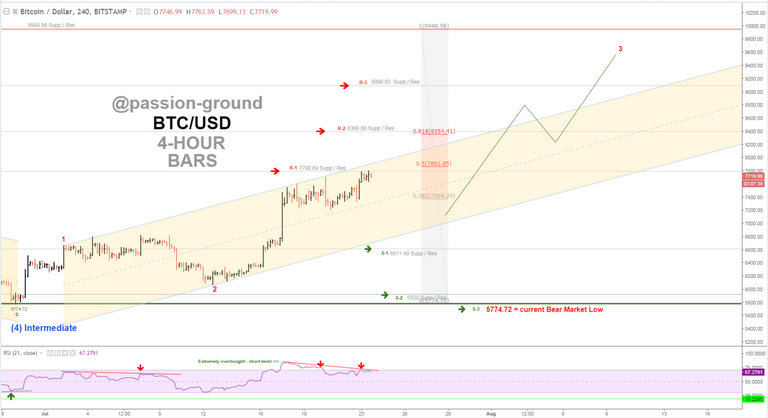
@passion-ground (neutral):
The above song is from a 1977 Isley Brothers album entitled, “Go for Your Guns.” Although most hodlers “went for their guns” a long time ago, the price of BTC is climbing, - it keeps pushin’ - and we’re bound to know. (If the recent low is going to hold or not – that is.) Though the ladder remains shaky, it still remains up that we gotta go! "Ain't nuthin' wrong, babe, in believin' in a dream!"
We were extremely overbought. RSI is showing divergence against those highs (4hours). That tells him we need to pull back some time. If we do so he would like to see that the uptrend channel holds.
TradeDevils (bullish):
He sees an algo target at 8'000 area. That is where he expects to move as wave 3 before we see a retracement.
The retracement he expects to be shallow to 7'600 area and than move up to a new high at 8'400 target.
We need to get over 8'500 which is critical to support bullish case vs. bearish case.
Symmetry of the wave support the bullish case as well (boxes) - in a bearish case first box would be a wave 2 and second box a wave 4.
After wave 1 is completed - he sees a ABC correction which is a great trade to do.
UglyOldGoat (bullish):
No news on market but he has written an interesting educational article.
check it out
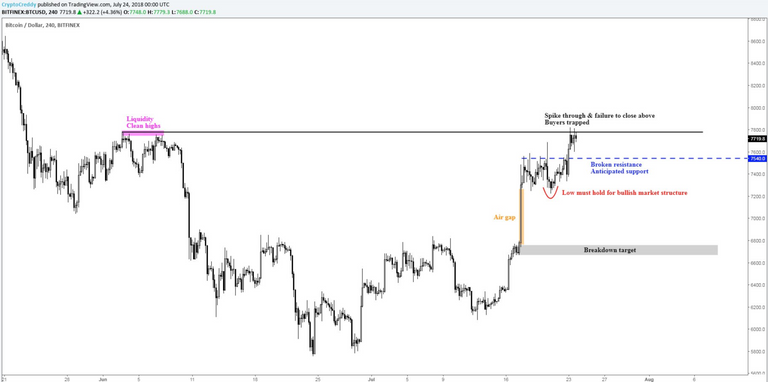
Crypto Cred (bullish):
Price reached yesterday's target — what now?
I'm favouring a retracement.
I) Price spiked into liquidity & closed below - buyers trapped
II) Untested S/R level at 7540s
III) Red low must hold to maintain overall bullish structure
Wrong if close through 7.8k.
Froflies (bullish):
We have a huge amount of resistance overhead.
8'200 has a lot of volume which give is relevance as resistance.
He expects a bull flag for some time before breaking through 8'100/8'200.
The cloud is quite large and has a lot of relevance. Last time we traded about 1 month in that cloud before breaking down. He sees that this time it is different.
He want a break above or below the cloud with volume.
That cloud is holding him back to go fully bullish - 8'700 needs to broken to get out on the top.
As soon as we clear 8'100/8'200.
He sees only strong resistances 10'000 and 11'600. The rest are not that strong in his opinion.
Reference table
| analyst | latest content date | link to content for details |
|---|---|---|
| Tone Vays | 23. July | here |
| @lordoftruth | 24. July | here |
| @ew-and-patterns | 20. July | here |
| @passion-ground | 23. July | here |
| @tradedevil | 23. July | here |
| Tyler Jenks | 18. July | here |
| UglyOldGoat | 24. July | here |
| CryptoCred | 22. July | here |
| Forflies | 23. July | here |
Definition
- light blue highlighted = all content that changed since last update.
- sentiment = how in general the analysts see the current situation (bearish = lower prices more likely / bullish = higher prices more likely). The sentiment is based on 4hr, daily, weekly, monthly candle charts.
- The forecast time horizon of candles can be compared with approx. 4hr = 1-2 days; daily = 4-14 days; weekly = 4 - 14 weeks; monthly = 4 - 14 month.
- target = the next (short term) price target an analysts mentions. This might be next day or in a few days. It might be that an analyst is bullish but sees a short term pull-back so giving nevertheless a lower (short term) target.
- support/res(istance) = Most significant support or resistances mentioned by the analysts. If those are breached a significant move to the upside or downside is expected.
Educational links:
- From @ToneVays: Learning trading
- From @lordoftruth: Fibonacci Retracement
- From UglyOldGoat: How to achieve the same results of a professional trader without taking the inherent risks
- From CrytptoCred: Several great educational videos - very structured and helpful
- From @haejin: Elliott Wave Counting Tutorial
*If you like me to add other analysts or add information please let me know in the comments.
https://steemit.com/bitcoin/@denha/etf-bitcoin-already-approved-by-sec
@denha how can i increase Repetition?
@famunger Sir how can Increase my Steem power
Nice info
see my last Bitcoin analysis in:
https://steemit.com/bitcoin/@omidmoaiied/bitcoin-in-the-next-few-days
see my last Bitcoin analysis in:
https://steemit.com/bitcoin/@omidmoaiied/bitcoin-in-the-next-few-days
Good luck to anyone, even to the brave analysts who sustain that the short term is bearish :)
Didn't know about your analysis @famunger, glad to have discovered your channel!
Finally see some bullish signs lately. Great.