Regular daily update on BTC ta analysts opinions.

**My summary - short-term sentiment: bearish ** (last: slightly bullish)

- BTC is currently correcting which is considered a healthy correction before moving further up in may.
- Target range of this correction by analysts: between 7'800 and 8'600.
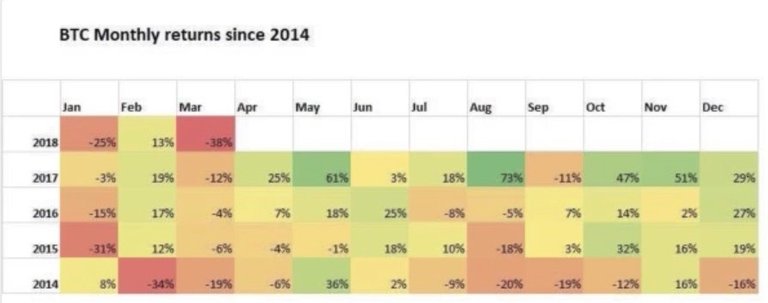
- April is used to be a good month for crypto. Lets see how this turns out this time.
News about the blog
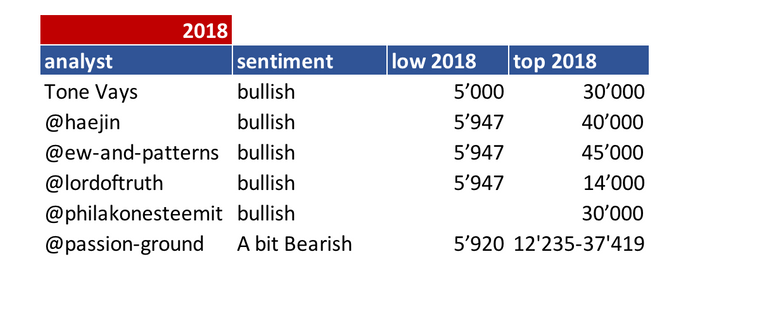
I need to revise my 2018 long term table. I need to add a 2018 and 2019 target an be more precise on the sentiment here. Will do that after I am back in Switzerland.
We lunched the bounty project beta. If you are interested and you like to create a bounty on your own have a look at this post
Analysts key statements:
Tone:

- Weekly: Nothing changed. Gains of yesterday have nearly been eliminated. He still sees bear market even though the weekly turned bullish.
- Daily: If current candle closes 9'300-9'400 it is possible that we go up to the death cross. If instead we go down from here it would be hard to time the trade. He remains generally bearish.
@haejin:
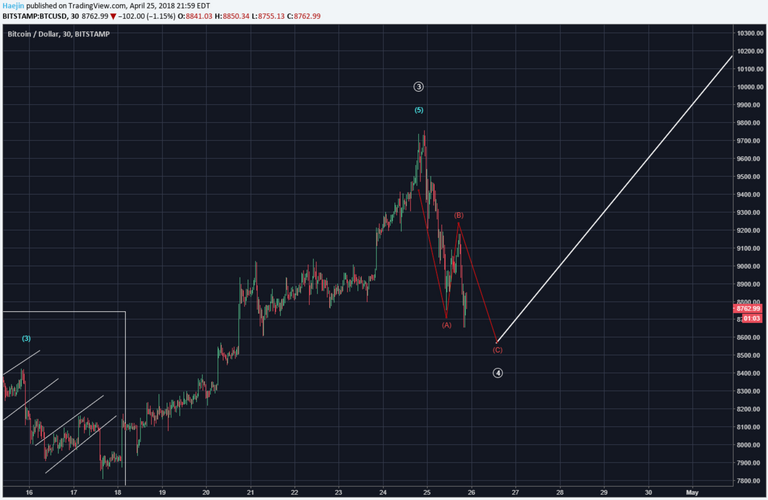
He sees minor correction in progress. The below chart shows that potential abc (red) correction before resuming towards the 5th wave.
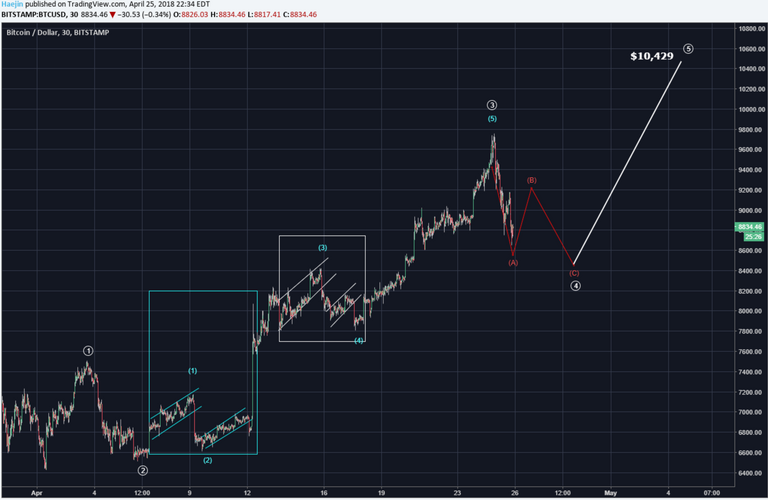
Alternate count:
@ew-and-patterns:
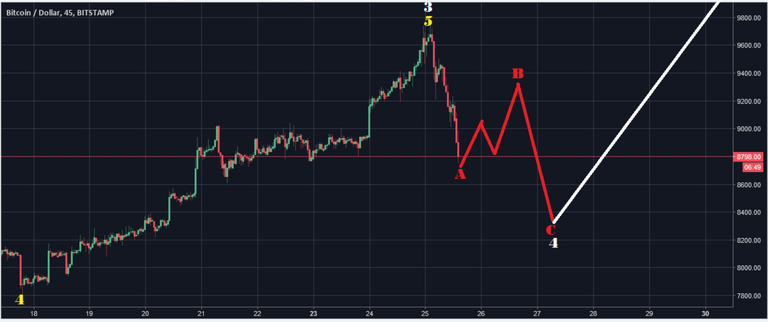
Expected drop in progress. Target is 8'500 - 8'000 area. From there wave 5 with a nice move up beginning of may.
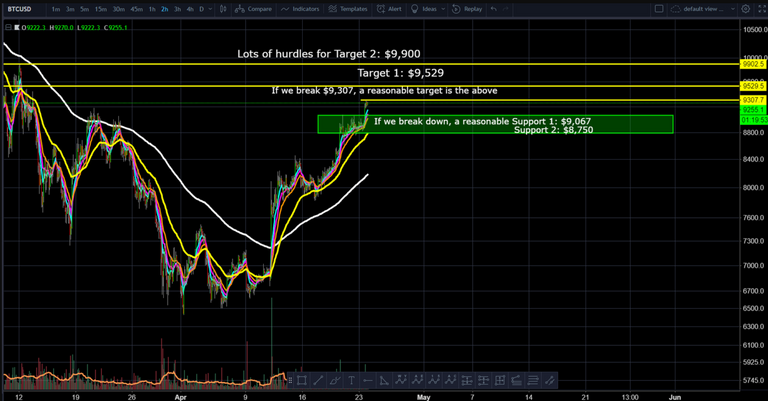
@lordoftruth:
Rejection from 9'760 pushed the price to 8'643 - move tries to form right arm of our reverse H&S pattern.
Correction is healthy after 35% gain. He expects a dip and close below 8'643 soon.
He sees the retracement will move the price towards the area of 7'640 - 7'870 to form right arm of reverse H&S pattern, followed by a rise towards at around 10'170 - 10'400K, followed by 11'780K ( 1W 38.20% Fibonacci ) to focus on the 12'400K ( Early June ).
Todays trend is Slightly bullish. Expected trading for today is between 8'350 and 9'185.
@philakonesteemit:
Bullish scenario got confirmed. Possible further small wave up to come. See bull/bear scenarios below.
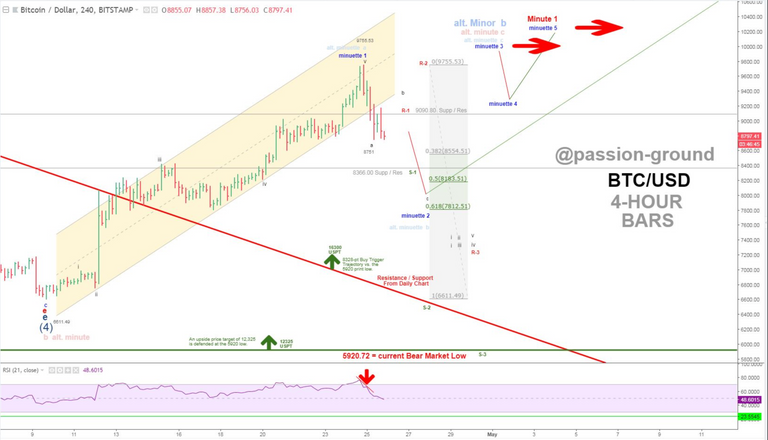
@passion-ground:
Though clearly wrong previously as to the level and extent of upside momentum inherent in the recent bullish thrust higher, it now, however, seems that a short-term interim pivot high may have finally established itself. Looking for some further downside from here and then very much counting on another bull run equal to or preferably surpassing the amplitude of the most recent run-up in terms of both time and price.
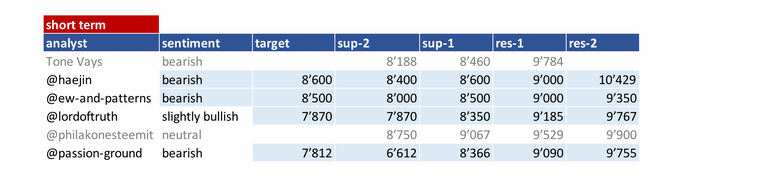
Summary of targets/support/resistance
Reference table
| analyst | latest content date | link to content for details |
|---|---|---|
| Tone Vays | 25. Apr | here |
| @haejin | 26. Apr | here |
| @ew-and-patterns | 25. Apr | here |
| @lordoftruth | 26. Apr | here |
| @philakonesteemit | 24. Apr | here |
| @passion-ground | 26. Apr | here |
Definition
- light blue highlighted = all content that changed since last update.
- sentiment = how in general the analysts see the current situation (bearish = lower prices more likely / bullish = higher prices more likely)
- target = the next (short term) price target an analysts mentions. This might be next day or in a few days. It might be that an analyst is bullish but sees a short term pull-back so giving nevertheless a lower (short term) target.
- support/res(istance) = Most significant support or resistances mentioned by the analysts. If those are breached a significant move to the upside or downside is expected.
- bottom = -> now renamed and moved to long term table. Low 2018
- low/top 2018 = what is the low or the top expected for 2018?
Further links for educational purposes:
- From @ToneVays: Learning trading
- From @philakonecrypto: Like in every post you find links to his amazing educational videos. For example here
- From @lordoftruth: Fibonacci Retracement
- From @haejin: Elliott Wave Counting Tutorial
*If you like me to add other analysts or add information please let me know in the comments.
Great post. Keep it up
good topic and information
I believe you are going to see a WAR at the 200 day MA up to 11600. I expect the first couple times to fail miserably.
The correction was expected, the correction of BTC affected all other cryptocurrency coin but Steem stood out as it was appreciating. Maybe it was due to Huobi listing
Thanks for the update! I think the beginning of May will be another good run! @famunger
It is nearly at $9,300.00 right now at 00:01 UTC, so I guess none of the TA are yet prediciting correctly.