Hello guys.
Let's do a small TA today. Now, this is my first TA post, and I'm no expert. So take it with a grain of salt.
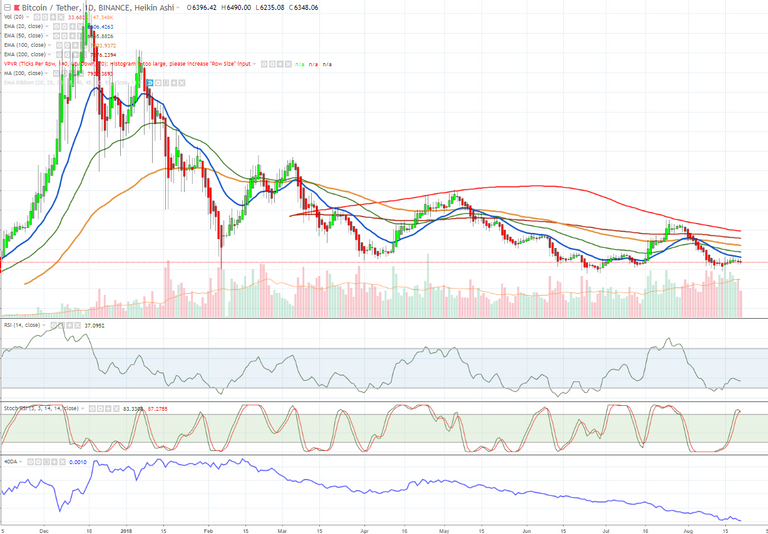
First thing first, bellow you will see bitcoin chart from Binance. IF you find it interesting, keep reading, I will explain everything in it, step by step.
To make it less clustered I hadn't added horizontal supports and resistances.
It's been a long time since all time high and seems that we will be in a bear for a while, now I'm not saying that this is for sure. All I'm saying is what charts are showing.
So, as you can see bitcoin has barely touched 20 day exponential moving average, that blue line, and was rejected.
What worries me here is this.
1: At the bottom 40DA indicator is my own indicator, witch shows 40 strongest cryptocurrencies combined. As we can see the alt season is far from beginning. One may consider here to do some TA on their favourite alts as this is a good time to accumulate them. But don't expect sudden growth. Not at-least in the coming days unless you are day-trader.
2: Stochi indicator, second from the bottom, shows change in momentum. Seems that bitcoin barley broke 80 stochi resistance just to get rejected again. What that mean? Well, it means that we are building downside momentum. Let's hope for silent cool-down(it's when bitcoin goes sideways and don't go down), but most likely we will test 6150$-6250$ support again.
3: Now let's go to RSI. On daily we didn't go over 50% range. It means that the selling pressure still prevails. It seems that we are going down now on RSI too. I would call this no trade zone as it was going up couple days before. Just to make sure.
4: Next is the volume. Volume is increasing. As you can see, if volume is increasing and bitcoin is going down, that's not a good sign. It indicates that there are big sell pressure from bears and they are still in the game.
Now there are some good signs too. As you can see, the spikes are becoming less and less violent. That indicates that we are closing to the disbelief phase. When bitcoin jumps up but people are selling off due to the expected low highs. Now, this is tricky. Remember, most if not 90% are usually left behind at that point and are putting in money at the last time just to find their portfolios sunk again.
Remember this is the period of work. Now, if you are wondering when bulls will be back. Well, I will give you that tip. Look at the red line - 200 simple moving average. That's the line you should look for. IF we are going to go up and brake trough it, then most likely you will start to see alts moving up again and not just by double digits. And when that will happen, you will see bulls back. But before it has happened, don't trade on wishful thinking. Trade based on TA and TA does show bearish market at the moment.
Congratulations @fiveinternet! You have completed the following achievement on Steemit and have been rewarded with new badge(s) :
Click on the badge to view your Board of Honor.
If you no longer want to receive notifications, reply to this comment with the word
STOPTo support your work, I also upvoted your post!
Do not miss the last post from @steemitboard:
SteemitBoard and the Veterans on Steemit - The First Community Badge.
Congratulations @fiveinternet! You have completed the following achievement on Steemit and have been rewarded with new badge(s) :
Click on the badge to view your Board of Honor.
If you no longer want to receive notifications, reply to this comment with the word
STOPDo not miss the last post from @steemitboard:
SteemitBoard and the Veterans on Steemit - The First Community Badge.