Good morning all, what a wild ride we've been on. I think it's safe to say finding the bottom is a rather difficult task and it's best to work with what the market gives you and not what you expect it to give you. It won't take long to find predictions on the market bottom, they're all over twitter with perma-bulls and perma-bears screaming and shouting at one another.
Today we'll be looking predominantly at the market cap for both the total market cap and altcoin market cap, firstly the 4 hour charts of both followed by the daily chart for the total market cap.
Fun Fact: Market Cap is short for Market Capitalization, find out more by clicking here.
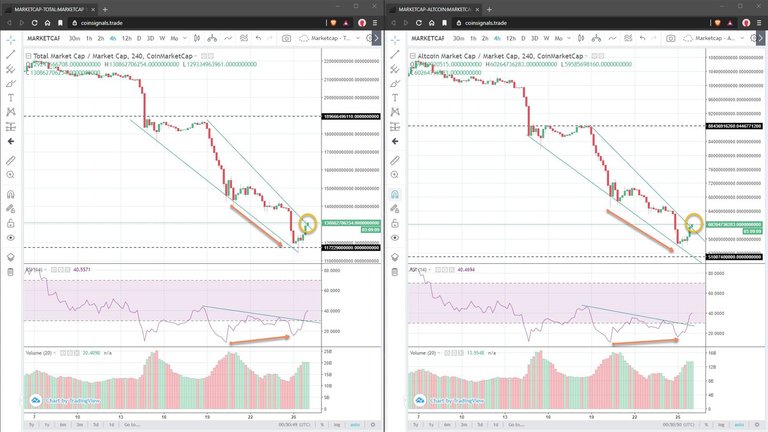
4 Hour Time Frame
We'll begin by looking at both Total Market Cap and Altcoin Market Cap together. Total is all of the crypto market including Bitcoin and Altcoin is all of the crypto market excluding Bitcoin.
 click for larger image
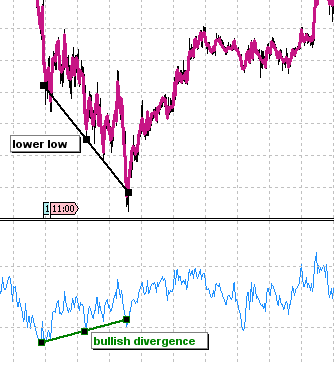
We're also breaking above the falling wedge pattern, this pattern can signal either a reversal or a continuation. To confirm the bullish reversal movement we need volume to support the upward momentum.
It's worth noting also that the RSI has also broken the downward trend, but as I mentioned before we need volume to support the upward momentum.
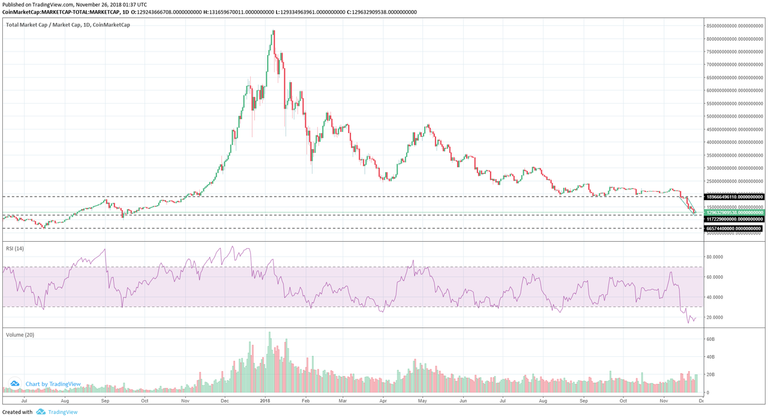
Daily Time Frame
 click for larger image
Remember we've looked at the lower 4 hour time frame above to see if the price action supports the bounce. Currently I'm on the fence, while the indicators show a fair abundance of evidence of a bounce/reversal the volume doesn't appear to be strong at this point.
If you scroll back up and look at the last few volume bars of the 4 hour charts you'll notice they've plateaued and when looking at the previous volume spikes after which they've plateaued, then fallen, along with the price.
The daily volume bar is clearly not as strong as the last bunch of selling volume bars which isn't a good sign.
So, to summarise...
- Bullish Divergence appearing on both time frames; however volume doesn't support movement at this stage.
- Falling Wedge reversal pattern; also needs positive volume to confirm.
- Bounce off 117bn support on the daily chart with previous day showing a hammer reversal candle.
Plenty of reversal signals, we just need volume.

Thanks for taking the time to read my article, help me out by donating and feel free to join any of the quality exchanges below with my referral links.
BTC:
3J9KJuC3BU7VzMyMegsHPAxu4sXvZwTfxk
ADA:
DdzFFzCqrht1GmkRMxkbKGqynsE4QRjYLbQ9SraJjP5Sj51tDc6iphbWjJRCxLZRZ885tF7jfXXYnfz6VCmVwQNxScVgdSwTZPMW1sGG
XTL:
Se4KBWBqJaTMEYvMwS8b5nZaQ2USWzs3nG5FknM1fEqz8XRq56dPxA45e6entubkHh31N4Pos48cAbdJVEFQZF7w1US2bMHKk
Get your cryptocurrencies from...
💲 Coinspot (for Australians): https://www.coinspot.com.au?affiliate=CH9W5
🤑 Binance: https://www.binance.com/?ref=10879807
💰 Kucoin: https://www.kucoin.com/#/?r=1y71c
👏 Cryptopia: https://www.cryptopia.co.nz/Register?referrer=fvknl
This is not financial advice, I'm just a stranger on the internet.