Ok, now we can be sure that head & shoulder pattern is complete. 'neckline' is breached and the price be prepared to go upper side. Today, I will present a possible price goals in short and middle term view, and try to predict when the correction will be come.
[DATA : BTCUSD 30 min, virtual RSI trend line(30min(blue dotted in the RSI section), 4hour(green dotted in the RSI section)), virtual neck line, virtual need supported line(yellow dotted, reference EMA(400))]
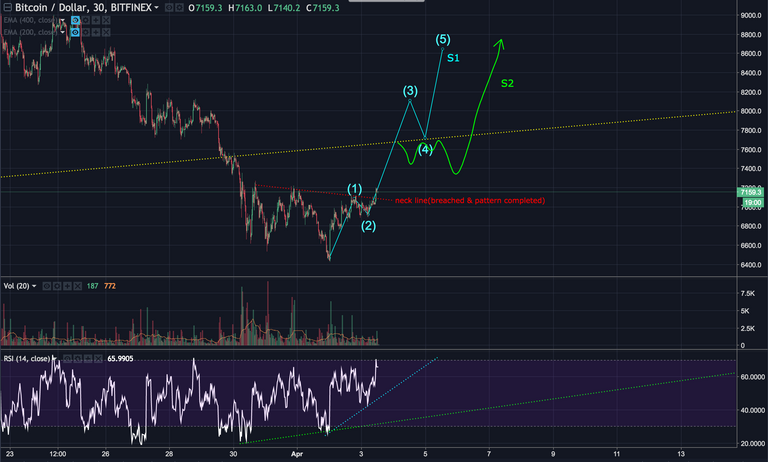
We can consider that elliott impulse is started. I can observe the wave (1) and (2) clear and now the price is going in to the wave (3). As I wrote in my previous post, the most commonly predicted elliott wave is a blue line wave on the chart(S1). However, this blue wave does not reflect the expected resistance and RSI cycle. Therefore, I think the S2(marked as a green line) elliott wave will be proceed and the target price for this elliott wave will be between about $ 8600 and $ 8700.
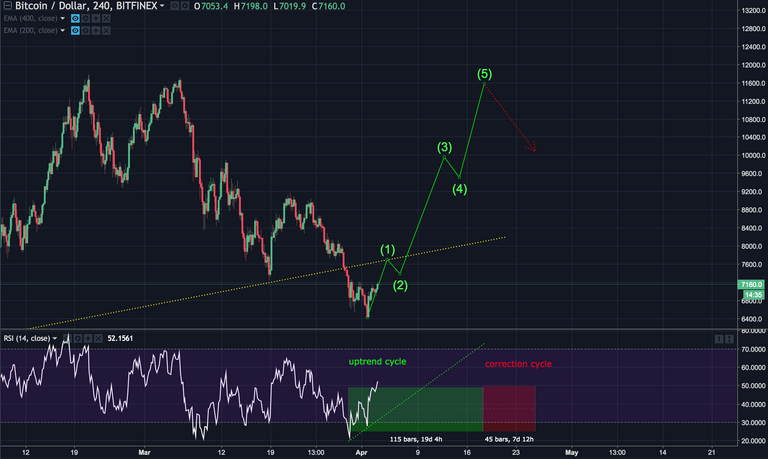
Next, from the middle term perspective, I present the estimated price path as shown in the chart below. This uptrend cycle expected with the virtual RSI trend line (candle / 4hours) will be completed around mid-April and while this trend continues we will be able to express this with a clear elliott wave. In this scenario the target price is about $11600. When this uptrend cycle is completed, a correction cycle will be start.
- If you get any help from this posting, press 'UPVOTE'!