Summary
In the last post I have focused on EMA and presented some scenarios for future BTC price movements. Today I'll talk about a pattern fractal.
[DATA: BTC candle / 4hour, virtual EMA line (candle / day, 120, 200, 400), RSI (standard setting)]
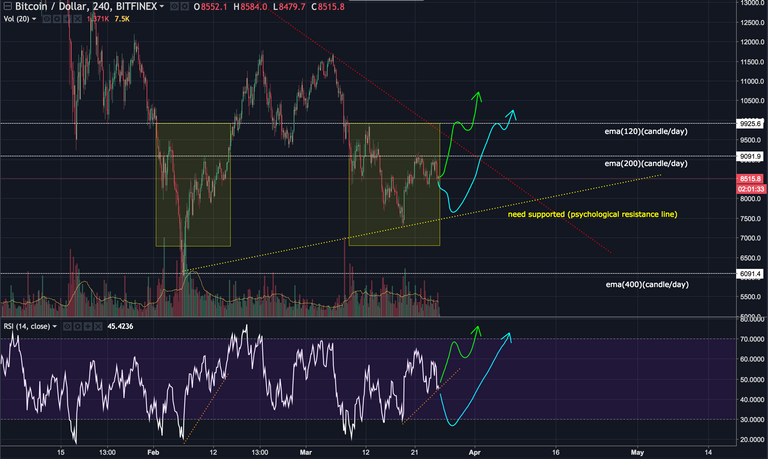
#1. In the yellow boxes on the chart, BTC is rising from the low point. In the course of the price movement, we can think of the possibility that the pattern in the previous yellow box will repeat in the back yellow box(likely that resistance and support has occurred at similar levels).
#2. You can observe a similar pattern in the RSI.
#3. If the pattern repeats itself completely, the BTC price will move along the green line. Note the possibility that the trend will change at the end of the green arrow that marked on the RSI.
#4. Note the blue expected path. If the RSI declines, a price move along the blue path will occur.
Response strategy
#1. Observe the RSI trend carefully.
#2. If the RSI becomes downtrend, hold the investment up to the orange line that I mentioned in the previous posting.
- If you get any help from this posting, press 'UPVOTE'!