What is the EMA?
The EMA is one of the chart's indicators that shows the average price of transactions that occurred within the set time frame. If you set EMA's time frame for 5 days, the average value of the transactions that occurred within 5 days is shown as a line in the chart. Typically, EMA is used to determine trends using multiple time frames rather than using single time frame. If the low time frame line is drawn higher than high time frame line it means uptrend(the majority of the participants in the market is benefiting during the period). And if the low time frame line is drawn lower than high time frame line it means downtrend(the majority of the participants in the market is loss during the period).
For example, we can think about a chart that three EMA lines with a time frame of 20 days, 60 days, and 120 days being displayed. In this case, if the 20-day line drawn below the 60-day line, it means that the person who made the transaction within 20 days is more likely to have loss than who transaction within 60 days.
EMA dead cross? A Red alert for Bitcoin.
In the chart below I have observed the long-term movements of bitcoin through the EMA(EMA's time frame settings are 20 days, 60 days, and 120 days each).
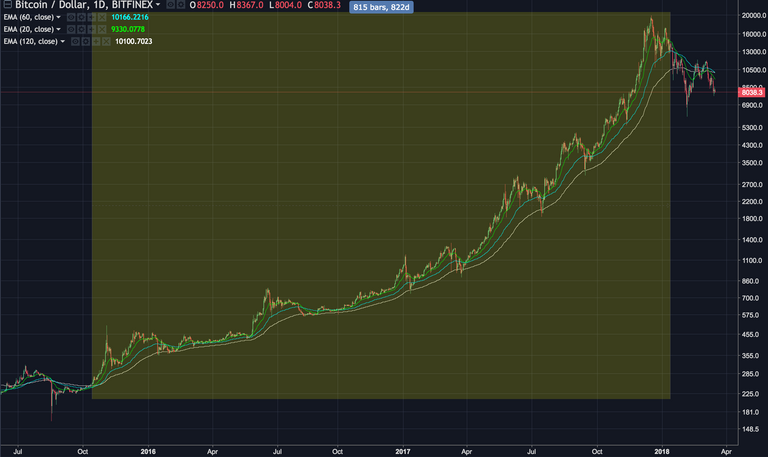
From 2016 to December 2017, Bitcoin made a very positive move. Almost all the time, the 20 day line was higher than the 60 day line, and the 60 day line was higher than the 120 day line. This means the investors have been able to benefit from Bitcoin trades during the above period. During this long uptrend most people(even if they were loss for a while) would have been able to make money by just 'HODL' their coins.
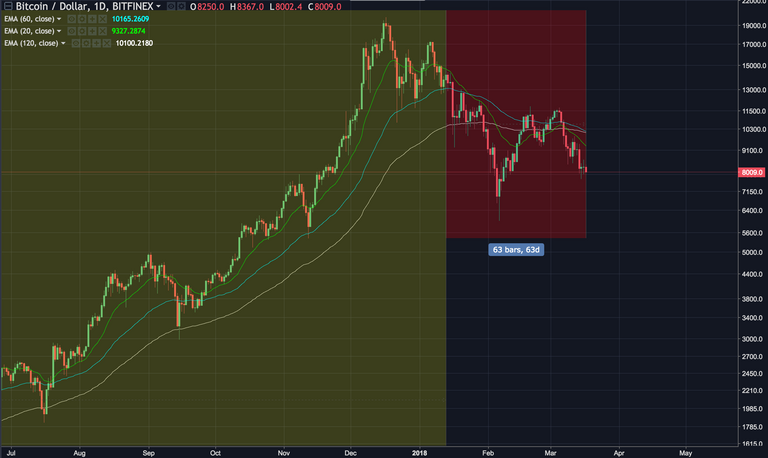
However, the situation has changed since the recent downtrend began. The 20-day EMA line fell over the 60-day line and fell bellow the 120-day line. And even the bitcoin price dropped below the 120-day line. This means the investors who invested within at least 60 days are looking at losses, and this is a sign of 'investment warning' beyond 'investment caution'. In present, the EMA 60-day line is trying to moving downward to the 120-day line , and if so it will be the beginning of a long downturn that lasts for months or longer.
Assuming the 60-day line falls below the 120-day line, we can find a similar case in 2014.
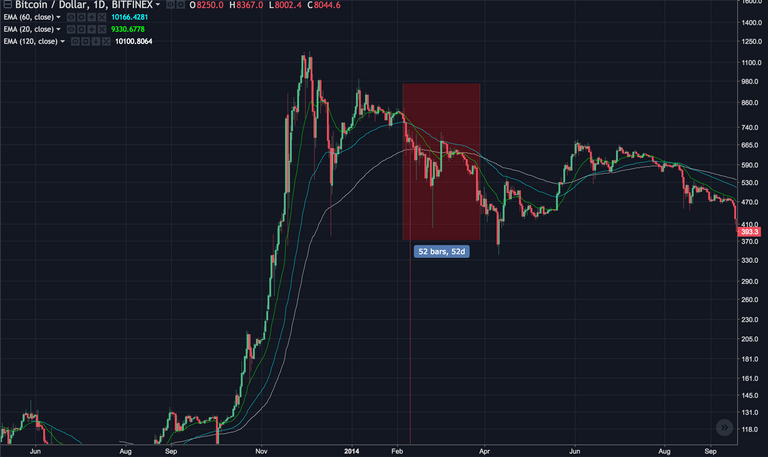
At the right end of the red box on the chart, the 60-day line dropped below the 120-day line. What happened after that?
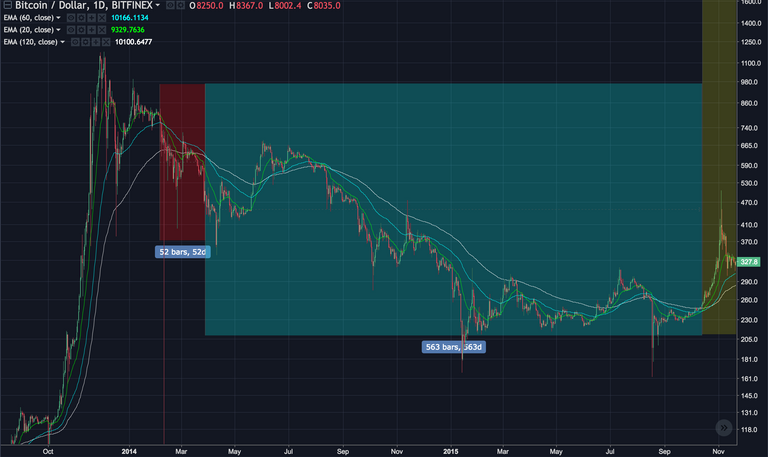
Bitcoin continued to downtrend for a tremendous amount of time until it hit a boom in late 2015.
So what should we do? The situation is pessimistic, but we are not need to be sure of the tragedy. We have not only a pessimistic forecast, but also have a possibility that the 60-day line will move closer to the 120-day line and recover again. We just need to watch the price move a bit more carefully. And I'm sure that you are ready to respond to the price movements.
- If you get any help from this posting, press 'UPVOTE'!