Today I try a very bold and aggressive prediction.
This analysis will focus on factors based on my experience and reasoning rather than technical factors.
(In fact, I had already done this chart a few hours ago. I was hesitant to release it because it's a too aggressive idea, but I decided to release it.)
Summary
I think RSI reflects the balance of buying sentiment and the level of sell sentiment. When the RSI is low, the amount of the buying sentiment is large, and when the RSI is high, the amount of the selling mind is large. Thus, the rising slope of RSI has a proportional correlation with the degree of price increase. In particular, for patterns that change trends, such as divergence, the rising RSI should be accompanied by sufficient price increases.
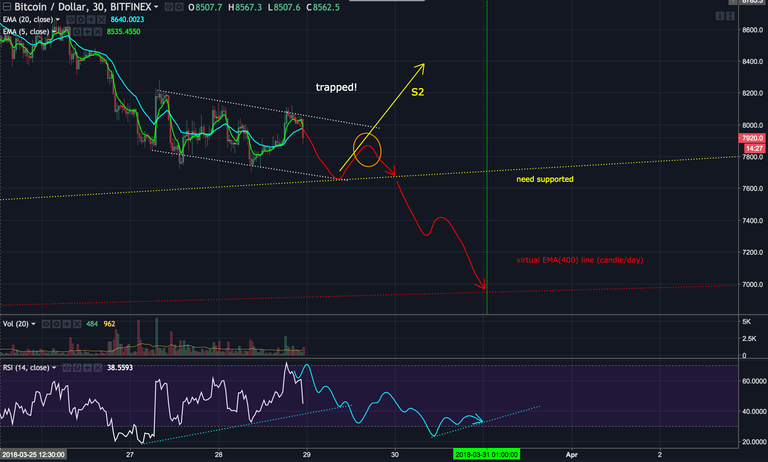
As I mentioned in my previous post, BTC price was nearing the 'need supported line'. Given the range of error, we may think there will be a rise after $ 7700. Actually there was some price increase, but it seems to me that this is not enough. (I do not think there is enough BTC price increase relative to the RSI rise. It seem like someone is deliberately depleting the buying sentiment.), so I think the BTC price is trapped between the white dotted lines on the chart.
In order for my past S1 scenario to work properly, the RSI rise must have accompanied a sufficient price increase. So this time I present the S2 scenario as an alternative opinion.
In addition, I consider a very aggressive inferencing, displaying vertical lines marked with a green dotted line on the chart. This line represents the CME futures market's deadline. I suppose that the above-mentioned 'someone (who deliberately depleting the buying sentiment.)' wants a price drop. He can try to lead the prices close to the EMA (400) to get the most profit.
To proceed with the S2 scenario, the down trend should not occur in the orange circle. I will take this point as an important point of future BTC pricing forecasts. If a down trend occurs and begins to decline, the 'need supported line' will be difficult to maintain. And in this case the final target price will touch the EMA (400).
Wow nice post. Keep em coming. will folloy you for more in the future :)
Thank you :) Actually I worried, but I'm relieved to hear you say so.