In fact, what happens at the turning point where the trend turns is very dramatic, but it is difficult to predict the exact time. In my previous post, I displayed the timeline(trend change has expected) marked with a yellow box on the RSI section. Fortunately, changes have occurred and are likely to continue.
[DATA : BTCUSD 4hour, virtual EMA(400) line candle/day, virtual EMA(200) line candle/day]
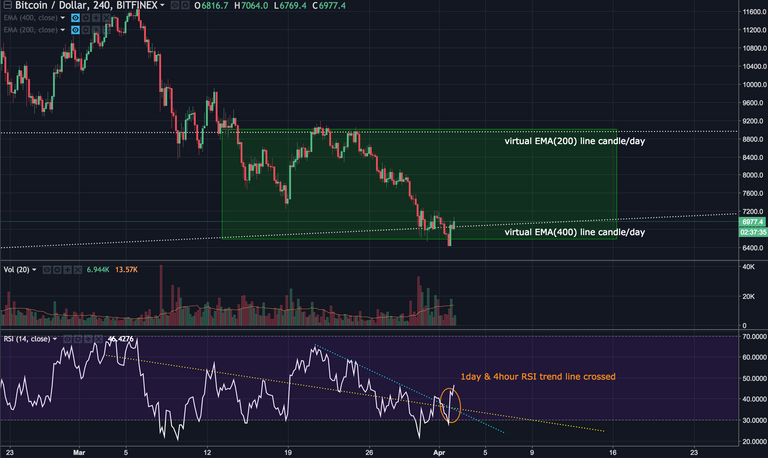
As mentioned earlier, one cycle of RSI has ended and a new cycle has begun. The chart shows that the cycle ends at the point where the RSI candle / day trend line and the RSI candle / 4hour trend line cross. It is unusual for trends to change exactly where these two lines cross. We can usually observe the trend changes in the day line after the changing symptom of the 4hour line appears. however, now the important thing is think about how prices will change.
I suggest you pay attention to the green box on the chart. This green box is an area between the EMA (200) and the EMA (400) line. A price movement that will shown in the green box will be an important indicator of future price prediction.
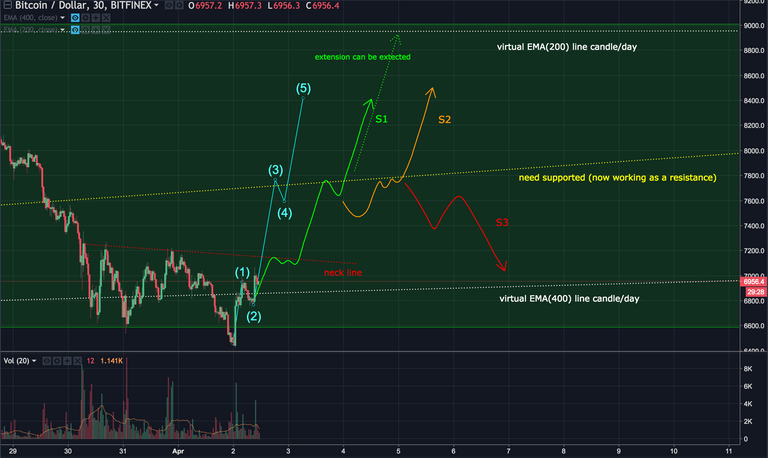
The transition to the uptrend always begins with the emergence of a clear elliott impulse wave. Therefore, the most commonly conceivable price movement is an elliott wave that marked with the blue line on the chart. But, there are several resistances that can be deduced from the previous price path.
First, is a 'neck line'. I was expect that 'neck line' will be breached when the right shoulder appears, but it's not. So, I think there is still remain a resistance at the 'neck line' whether the Head&Shoulder pattern has completed; In fact, this resistance is not due to the pattern, but rather because of the persistent unrest in the market.
Next resistance is in the 'need supported' line that was worked as a support line before. I think the resistance to be generated in 'need supported' line is strongest, so I present some scenarios that can happen based on this line.
S1. Price Explosion
This scenario is accompanied by a robust buying power, and breach the resistance line immediately. As I mentioned in previous post, in order for prices to explode we must need a massive volume support. If a massive volume appeared at wave (4), we can expect an extension in the wave (5).
S2. Stable rise
This scenario is a case with a slight delay in each resistance line. The price will rise steadily and the market anxiety can be eliminated most effectively. This scenario is my primary count.
S3. Broken, and down
If there are some bad news that we do not know yet, it may be possible. But the trend has been switched, this scenario probably will not work.
- If you get any help from this posting, press 'UPVOTE'!