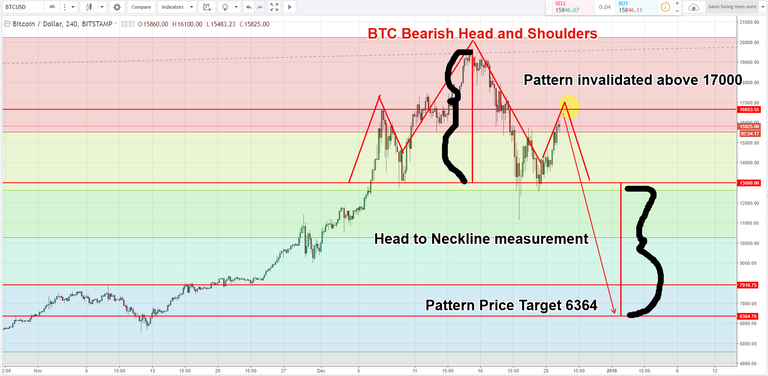
The rapid drop from an all-time high of 19484.98 (Tradingview) to 11159.93 caught buyers by surprise. The spectacular 42% decline may only be the beginning of a deeper decline. The bearish Head and Shoulders Pattern is one of the most recognized price patterns in Technical Analysis. It usually indicates a large price drop.
Traders measure the top of what is called the "head" to the bottom /"neckline" to forecast how far prices can fall. In the case of Bitcoin, 6364.76 is the target.
These patterns can breakdown and fail. If waves of large new money flood into bitcoin, then this pattern would be invalid.
If Bitcoin can reach the 17,000 mark and hold above it, then 25,000 and above would be more likely and the Bearish Head and Shoulders pattern would be history!
Whether you trade gold, Facebook, silver, oil, Euro forex or Ethereum it pays to understand the principles of Technical Analysis. Technical Analysis involves the learning of indicators and price patterns that can forecast price action.
If you have questions, comments, or suggestions please post. You can also email me at [email protected]
Thanks for the technical analysis, What do you think about the alt market? will it dropping to if we are going in a bearish head and shoulders pattern ? Upvoted you
Hello Mark. I'm in a few altcoins as well; CND, TRX, MANA, QSP and they are languishing. However, there are a few pockets of strength with good trends and pullbacks like IOTA, MTH, Ripple(XRP) https://gyazo.com/9069a163c9eb0052b658c65b407ba8e0
If you have a particular list of symbols that you are interested in, just post and I will post a chart analysis of them. TA works well if they have a few months of data