
SUMMARY
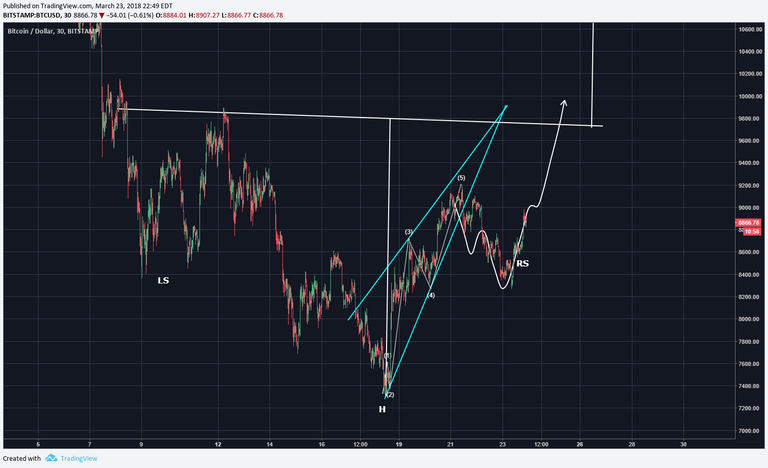
This post will take the price development analysis from the short term to the bigger picture perspective. Bitcoin (BTC) has been adhereing to the scribbled line drawn per Fibonacci and Elliott Wave levels quite well. Not too shabby! The RS of the IHS pattern is well in progress.
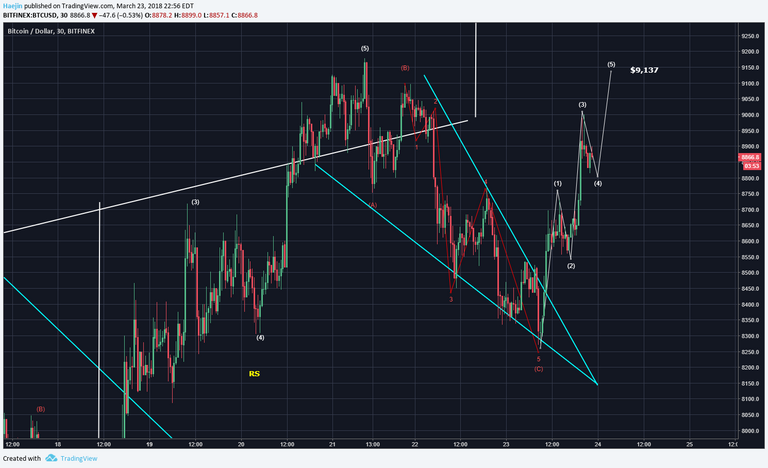
The impulse is well underway and while wave 3 could extend further, the below chart shows that all but wave 5 are completed. IF this count is correct, then wave 5 should hit around $9,137 as a short term target.
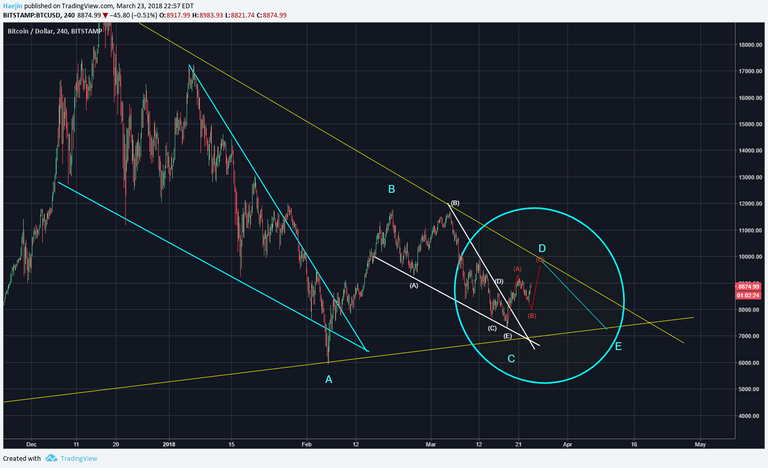
Here is the blue wave D trajectory. The red abc are the subwaves of blue wave D and thus far red A and B are complete and C has already started up.
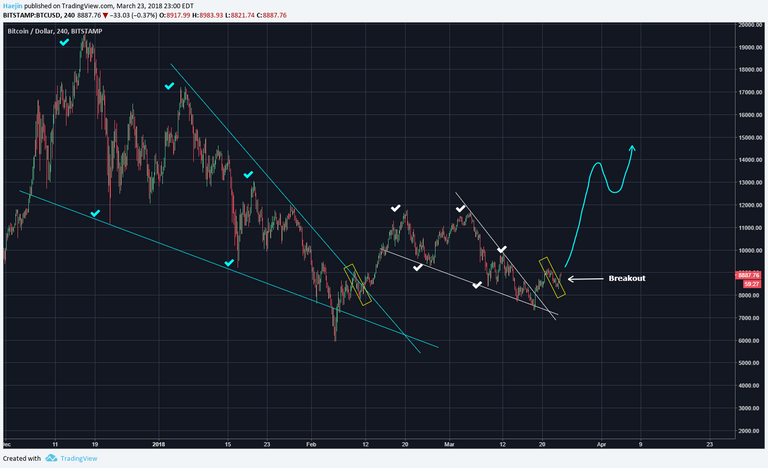
As shown this morning, the fractals are playing out very nicely under close correlation. There is a breakout!
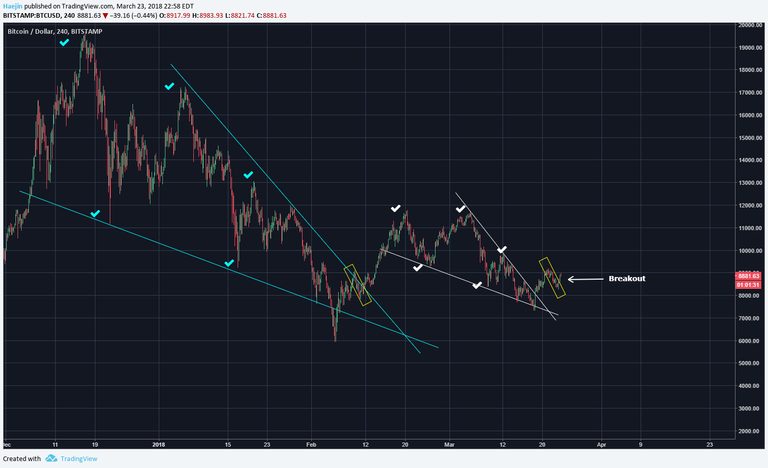
More scribbles to show the projected price pathway. This projection allows the $11,800 persistent resistance to be breached. Let's see what happens overnight.
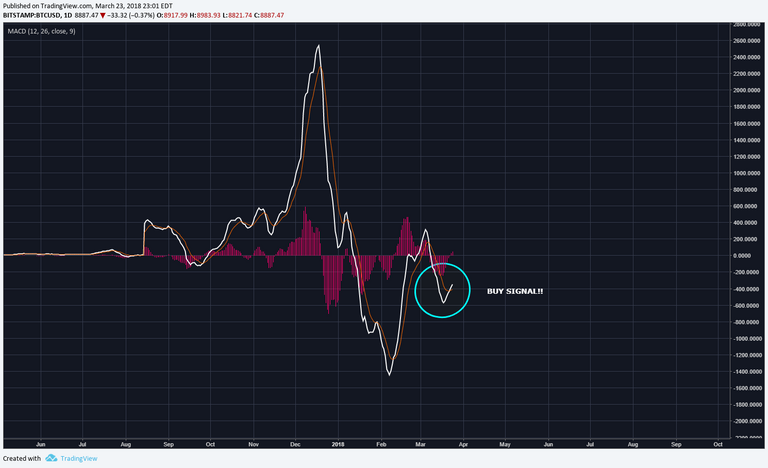
Here is the daily MACD and it's crystal clear that the white MACD line has crossed over the red line. This is a buy signal! Also, the red histogram which is the 9 day moving average, has gone positive. Witnessing such birth of a buying signal and breakout is always exciting to an analyst!
Legal Disclaimer: I am not a financial advisor nor is any content in this article presented as financial advice. The information provided in this blog post and any other posts that I make and any accompanying material is for informational purposes only. It should not be considered financial or investment advice of any kind. One should consult with a financial or investment professional to determine what may be best for your individual needs. Plain English: This is only my opinion, make of it what you wish. What does this mean? It means it's not advice nor recommendation to either buy or sell anything! It's only meant for use as informative or entertainment purposes.
Please consider reviewing these Tutorials on:
Elliott Wave Counting Tutorial #1
Elliott Wave Counting Tutorial #2
Elliott Wave Counting Tutorial #3
Laddering and Buy/Sell Setups.
Laddering Example with EOS
Tutorial on the use of Fibonacci & Elliott Waves
@haejin's Trading Nuggets
Essay: Is Technical Analysis a Quantum Event?
Follow me on Twitter for Real Time Alerts!!
Follow me on StockTwits for UpDates!!
--
--


Thanks for sharing! Will get some btc now and hopefully it works
Hence the reason to maintain 15% of portfolio as cash to deploy.
can we say the correction is over and bull run in place
Bearish Rising Wedge Found? Bitcoin to $6,000?!
I think its soon to say that but bull run will come sooner or later
Make sure you downvote all of @Haejin's scammy post!!!
Hgin You should stop your SCAMS NOW!!!
https://steemit.com/stewardsofgondor/@iknowwhoyouare/i-haven-t-gone-away-and-continue-my-efforts
YOU CAN EARN MORE MONEY ON STEEMIT BY DOWNVOTING @HAEJIN
VISIT @FLAGAWHALE FOR MORE DETAILS
Been watching your BTC updates for several weeks now, have learned a lot and admire your skill and your discipline, you really nailed it this time. Good work Haejin! Would enjoy another EOS chart and one on OMG. Thx.
good work for help
i appreciate the details. More of that, please!
I appreciate it. As an analyst, I need to call it as I see em.
Hi Haejin, any chance you could cover SMART on HitBTC. Amazing decentralized privacy coin with masternodes.
Yes, I'll do it tomorrow.
YOU, sociopath are afraid of getting more exposed! I can smell the fear!
your post is very good.
you do not know me yet. I am a newcomer to steemit. but I know a lot about you.
you are a great person.
i need support from you. thank you
I always look forward to your posts.
Guys during our wait to see what happen with Bitcoin I invite you to check this airdrops channel, the channel is continously update https://t.me/gtga_channel
Ok so what you are saying is we have now entered the bull market? In your expert opinion
I dont think we are in bull market,but it will come for month,or so.
Haejinku great analisis, we are fly up:)
Maestro give me analisis krypto, MDA. Thank you in advance.
Thank you for leading the way in this competitive market!
Haejin,looks like you are not interested to make TA for Verge at all.But look what is happening right now.Why you avoid to make TA?
Congratulations, your post received one of the top 10 most powerful upvotes in the last 12 hours. You received an upvote from @ranchorelaxo valued at 130.79 SBD, based on the pending payout at the time the data was extracted.
If you do not wish to receive these messages in future, reply with the word "stop".
Congratulations @haejin, this post is the forth most rewarded post (based on pending payouts) in the last 12 hours written by a Superhero or Legend account holder (accounts hold greater than 100 Mega Vests). The total number of posts by Superhero and Legend account holders during this period was 49 and the total pending payments to posts in these categories was $2178.44. To see the full list of highest paid posts across all accounts categories, click here.
If you do not wish to receive these messages in future, please reply stop to this comment.
The chart is working.. - with support and resistance levels..
The resistances are valid, but not your wave counting; wave 4 cannot overlap wave 1, except in strongly leveraged markets, and to a acceptable point. This occurs within your chart between (D) and (E). Why and how to label it then? Compare your labelling with Haejin's ;)
The chart has been playing correctly for about two weeks now. No invalidation so far.. seems like 5 waves down is a must.
Go AWAY and don't come back to play.
Every time @haejin predicts prices up, the prices tank.
So here we are at $8,500 and sinking. ALL DUE TO @HAEJIN
Please Haejin, we need you to start predicting price drops, if you really want us to make any money
Make sure you downvote all of @Haejin's scammy post!!!
Hgin You should stop your SCAMS NOW!!!
https://steemit.com/stewardsofgondor/@iknowwhoyouare/i-haven-t-gone-away-and-continue-my-efforts
YOU CAN EARN MORE MONEY ON STEEMIT BY DOWNVOTING @HAEJIN
VISIT @FLAGAWHALE FOR MORE DETAILS
The Truth. Truth always is and never isn’t.
mistaken post. I can't delete because of reply.