
SUMMARY
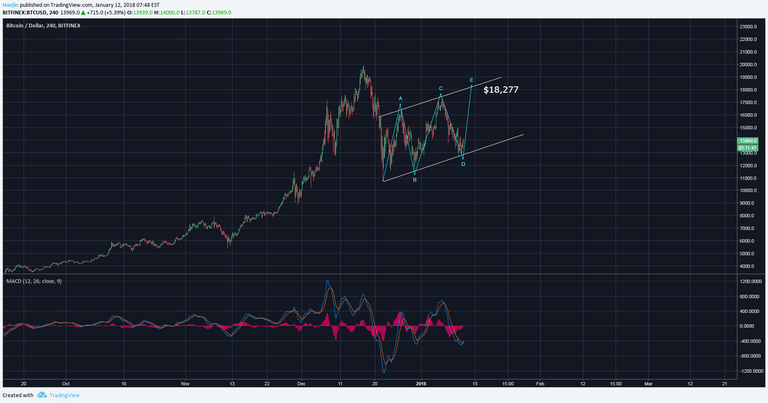
Overnight, price action has started bouncing off the bottom of the price with the MACD curling back upwards. This can be seen in the below chart for the triangle pattern which is my primary count. If the bounce is hapening now, then $16,206 should be the wave d zone and price should then decline towards the $13,821 zone to complete the e wave.

Below is the chart for the bear flag alternate count. The MACD also is curling up just like it is for the triangle pattern but price in this bear flag pattern could enable a bounce towards $18,277 for the blue E wave. So the key is that if price exceeds $16,206; then likely the blue E wave is in play. IF price bounces down from the $16,206; then likely the final red e wave of the triangle is in play. So, let's see how the day time price action carries on.
Please consider reviewing these Tutorials on:
Elliott Wave Counting Tutorial #1
Elliott Wave Counting Tutorial #2
Elliott Wave Counting Tutorial #3
Laddering and Buy/Sell Setups.
Laddering Example with EOS
Tutorial on the use of Fibonacci & Elliott Waves
These Technical Analysis Books: Elliott Wave Priniciple & Technical Analysis of Stock Trends are highly recommended
@haejin's Trading Nuggets
Essay: Is Technical Analysis a Quantum Event?
Follow me on Twitter for Real Time Alerts!!
Follow me on StockTwits for UpDates!!
--
--

If this blog post has entertained or helped you to profit, please follow, upvote, resteem and/or consider buying me a beer:
BTS Wallet - haejin1970
BTC Wallet - 1HMFpq4tC7a2acpjD45hCT4WqPNHXcqpof
ETH Wallet - 0x1Ab87962dD59BBfFe33819772C950F0B38554030
LTC Wallet - LecCNCzkt4vjVq2i3bgYiebmr9GbYo6FQf

Legal Disclaimer: This is only my opinion, make of it what you wish. What does this mean? It means it's not advice nor recommendation to either buy or sell anything! It's only meant for use as informative or entertainment purposes.
The master Haejin has taught me well! Posted this an hour ago:
https://steemit.com/bitcoin/@benkalashnikov/bitcoin-btc-analysis-63-potential-profit
Although @haejin has suggested if a bearish flag...it won't hit new high but hit around $18,000 and come down hard...
I guess we have to pick our poison....
how would it be a poison if the triangle turns out to be the correct pattern? and even if it comes out as a bearish flag then thats even better since I will get a pretty decent discount then.
nothing to be worring about at all
25k by the end of Jan. Perfect buying opportunities at the moment. We've seen this pattern many times.
well yes, thats basically what @haejin's projecting for the last couple of days :-) good luck :-)
Thank you :)
I have found last night's and this morning's analysis to be some of the most informational of all the videos you have made. The market is very uncertain at this micro moment. The price may go up or it may go down. We all know that BTC will eventually go up way much higher eventually. But in this moment uncertainty prevails. Knowing that the probability of movement will depend on where the negative bounce might occur makes one more comfortable with the result - regardless of whether there will be further price reduction or not. The discussion really taught me a lot. Thanks.
Nice work @benkalashnikov ! Great detail!
Thanks, appreciate it!
It's amazing BTC is holding it's own, considering all the setbacks it's been dealt
Its picking up !
Well explained and your predictions are quite logical. Learning a lot day by day by your posts.
appreciate for the update.
I'm excited to see whats happeneing next, I'm ready for both scenarios :-)
Hi @haejin I see you are using 100% power up option. You might not want to do that. I wrote a detailed post explaining why, you should read it.
DON'T USE 100% POWER UP - You Will Lose a Lot of Money
thank me later ;)
https://steemit.com/steemit/@scarlet7/an-agreement-has-been-reached
There is a reason he is doing it, but your post has value to others...
Thanks @matthewwarn I understand your clever answer
I think he made an agreement or something of that nature? To appease the trolls. I would never do anything to appease the trolls, myself :-p
see the agreement with berniesanders
Video didn't work. Thanks for the update, Haejin. Good analysis as usual! I also get tired of people who expect you to predict the future. Thanks for showing multiple price pathways. Things like that are necessary to keep the trolls at bay.
Cheers, brother.
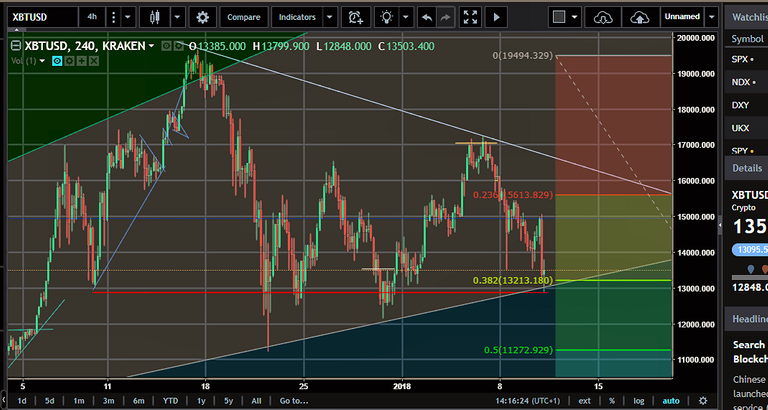
No reason to get excited, here's the Gann Fan and the Fibonacci to show that we might be in for another dip to 11500 (0.5 Fib), but we had that - and overall, the grey Gann field should be our trading channel.
Bugger off, FUD ! Hodl on, what else. The chickens who fled will eventually be back...
Hello Everyone! I am trying to figure out if this figure has just formed a cup and a handle or is it forming a triangle. Your insight is highly appreciated! Thank you so much!
It may have been a cup and handle for three months, then failed likely because
doge shot up - would be interesting to see if it succeeded against fiat.
I would now treat it as a triangle that should break out soon, but that's hard to say at this scale.
Could you please analyse Gulden (NLG)?
Could you please do an update on district0x? (DNT)
It's a solid coin with a dev. team putting in consistent effort into it.
See my thoughts on Gulden here:
https://steemit.com/bitcoin/@macmanux/nlg-gulden-500-profit-potential
So, if the price maintain in the bear flag, could I tell that the Boolinger Bands will close more and more?
Also, the video is not working :(
@haejin can you help me understand something? First off, I can't thank you enough for your analysis and lessons. I've learned so much, and have made MASSIVE profits - all thanks to learning about TA from you. My question is about LTC. Looking at the daily or 8 hour chart I see the 1, 2, 3, and 4 Elliot waves that brought it way up to over $200. I missed out on most of wave 3, but I got myself lined up and ready for wave 5 but it hasn't happened.
I'm sure that this doesn't "disprove" anything, and there's just something that I don't yet understand and I'm hoping that you can help me learn.
I believe you mixed (3) with (5). you have a very obvious correction in front of you, thats already an indicator. and for counting the subwaves that would confirm (1) and (3) you simply need a higher resolution.
also you clearly struggle when it comes to label the correction, and thats because you cant rely entirely on EW but must apply pattern-recognition as well.
I can accept that, but where do you see the 1 and 2?
Interesting. Is that a daily chart?
yes
i didnt open the chart but from your screenshot i would say that 1 & 2 are correct, simply change the postion of 3 & 4 and put 5 on the top
Also, the man himself called it wave 3. I know that he has revised waves before, but it really does seem to look like wave 3.
Post from last month: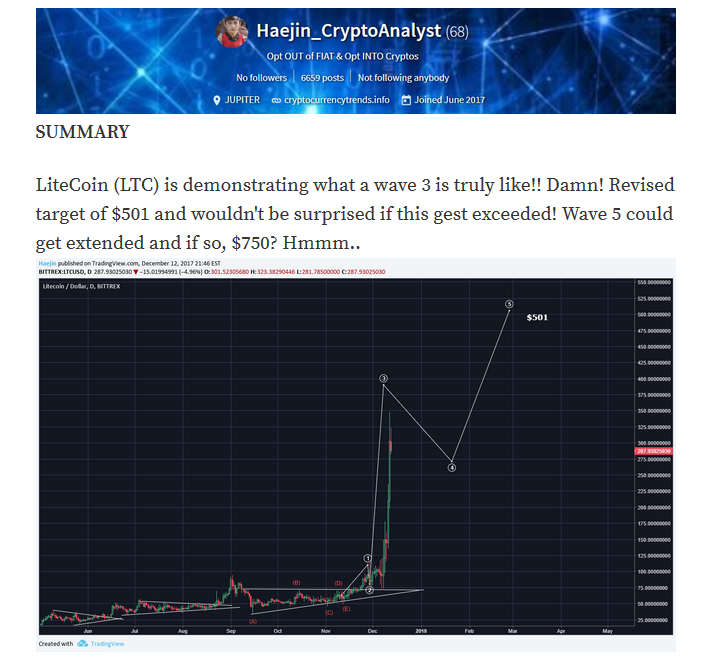
that's why I don't like to strech the 3 to much, I always use the 1,61 fibonnacci and when price is near that point I keep an eye open.
one main lesson you should have learned by now is to remain flexible.
anyway seems haejin quit nailed it with his call and I guess the reason why haejin has chosen not to put (3) lower is that it might almost be shorter then (1), so from this perspective I would agree with his count as well.
maybe some more inputs from the community?
Input from the community would be great! Upvote my original post to get some more visibility. I upvoted yours, so I'm not just out for the steembux
That's how I see LTC in the long run.
https://steemit.com/bitcoin/@macmanux/ltc-btc-pair
When it come to the original question, I would count the waves like so on LTC USD.

Notice that this gives the whole pattern the right look with wave 2 retracing about 50% of 1. Wave 3 is extended and 5 is 1.216 (time) the length of 1.
Thanks mate
What's your long-run view look like now, out of curiosity?
I think a lot of new people came into cryptos just before Christmas and took profits. The lull in price is partly due to those new people not yet coming back into the market. I've seen crypto do this many times. Now with Korea talking of a ban, it just makes me think it is the low before we push onto the next high. Remember last time when China banned exchanges, prices were low for a while, then a sudden upmovement.
Also predicting 25k by the end of January.
look at QLC, big profit potential https://steemit.com/qlink/@wizzdom/qlink-qlc-big-profit-potential
Thank you!
Nice @haejin, I did not know about this type of divergence.
Looking it up I found this cheat sheet.
https://www.babypips.com/learn/forex/divergence-cheat-sheet
Thanks again maestro!!
Macmanux, thanks for putting that up! Good read and helpful.
Most welcome!
i respect to you. im gonna study elliott.
good decision and good luck with it!
Thank you sensei.
Sir, what is bts ?.
What crypto currency can i invest on.
BTS is BitShares. There are many good ones to invest in, but that's for you to figure out which is best for you. Nobody can tell you the best one for you, but Haejin can help you by showing you the differentiating factors that will help you come to a clear decision. I hope that helps. Cheers!
Thanks
I can't see the video.
Informative post.Thanks for sharing it
but does the target price for 2018 remains at $20k?
where you have this weird info from? after the correction we will be well above 20k
thanks for sharing. Very good stuff!!
Thanks for sharing. I don't have to go online to check for todays updates
first
good job!
Very Good Analysis i trust your analysis.
Here is my take.
it will do a couple of more ups and downs an then it is ready for the new ATH.
Here is my blog for altcoins and bitcoin.
Follow @asifgoraya123
This roller coaster ride is driving me crazy, I'd better stop day trading and only come back in some years haahaha.
Btw, can you take a look at Kucoin Shares, it is going up vertical both the exchange market cap and their crypto.
Here it is.
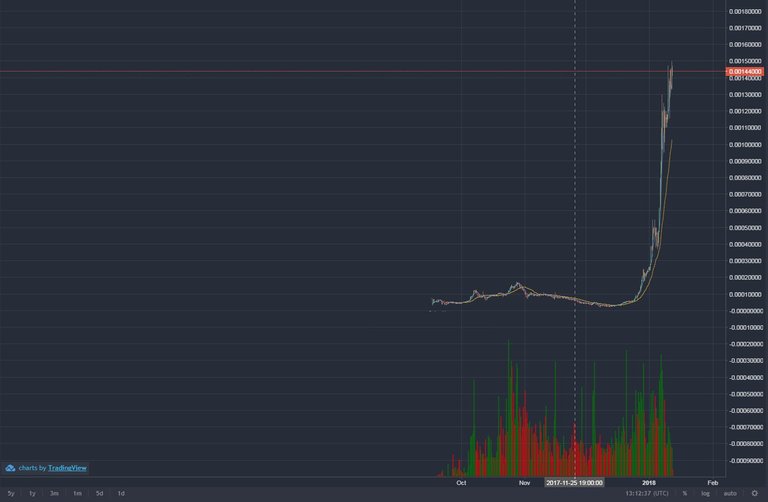
I know it'a going to correct at some point, but I going nuts maping the Elliott Waves. It always looks like it's correcting.
Really detailed explanation of the triangle and bear flag possibilities. It looks like above 18,000 for bitcoin in the near future. Thank you for another fantastic post.👍
Initial 6 months of investment in crypto is exciting, after that it feels risky
Glad to see the post @haejin, thanks for sharing. Send regards for success.
I follow ur post with excitement always!
You are my good teacher.
What is the link to register for your group lecture scheduled on 1/ 20 Sat?
And the cost?
what group lecture? I'm a über-stalker and never heard of this info :-)
I hope it will pick up steam.
regarding everyone complaining about the video not bein available, it is still uploading and it takes time for it to appear available on youtube.
It is everytime the same, just give it a few minutes..
Sorry to everyone who disagrees but I am really hoping for the alternate count. Not only for my own selfish reason of BTFD, but because it will be the most healthy and allow for the most long term continued growth for all.
well even with the triangle scenario we are not too far away from the next major correction if you do the EW count
Not so sure my count would agree with you. Is this not a major 5th wave correction?
Gracias por la información
Thanks for this! Would also love an update on SBD....I'm just letting the SBD sit for now, hoping for a rebound...
https://steemit.com/sbd/@haejin/steem-dollar-sbd-readying-to-explode-target-usd21-95-or-higher
Here is the most recent one... obviously the getting ready to explode part didn't happen in the few days since it was posted, but it is likely just a delayed version of the same pathway. Nice to see you following haejin, David.
always nice my friend. be sure to see my Bitcoin Cash technical analysis with elliot wave as well. https://steemit.com/bitcoin/@philakonecrypto/bitcoin-cash-bch-january-12-consolidation-then-future-explosion-longer-term-target-usd4-365-to-usd5-495
Without Haejin's TA a lot of us would be clueless. Haejin takes away all fears.
It seems bernie is starting another feud with you.
Hopefully this isn't another bullshit flag war
No! Once bitcoin rises again, alts will finish partying!
thats basically what @mitrado just said, even tough I cant agree with it entirely