
SUMMARY
Note: I'm traveling today so no video updates until evening.
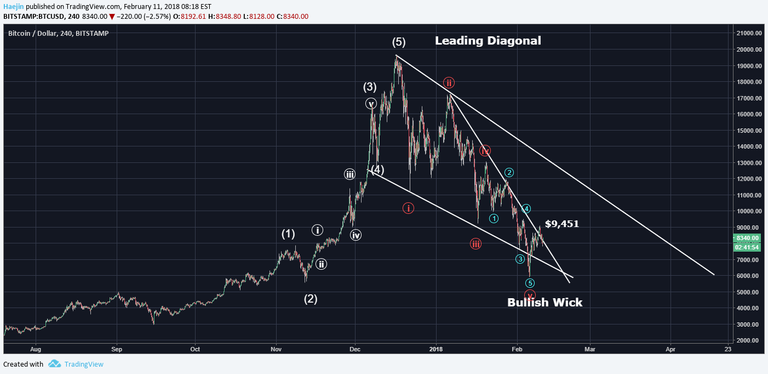
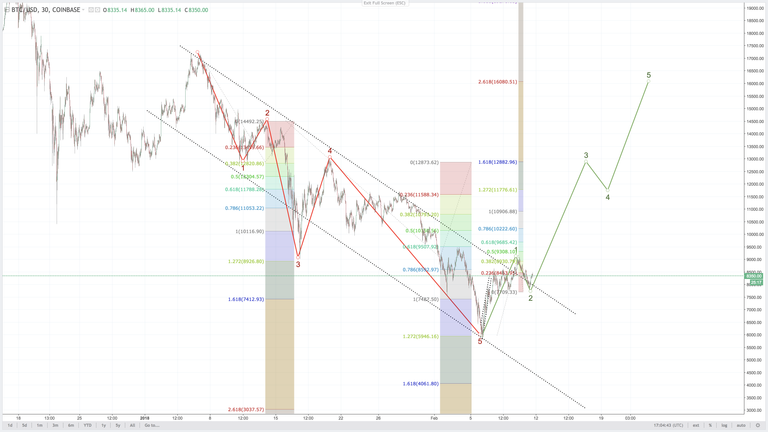
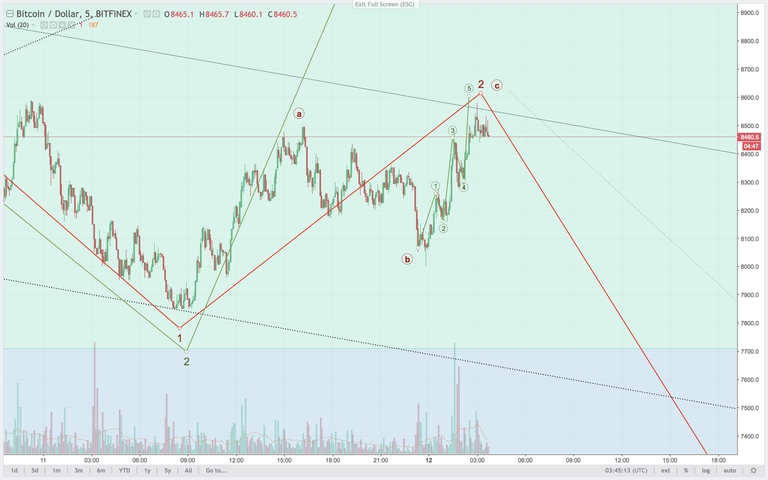
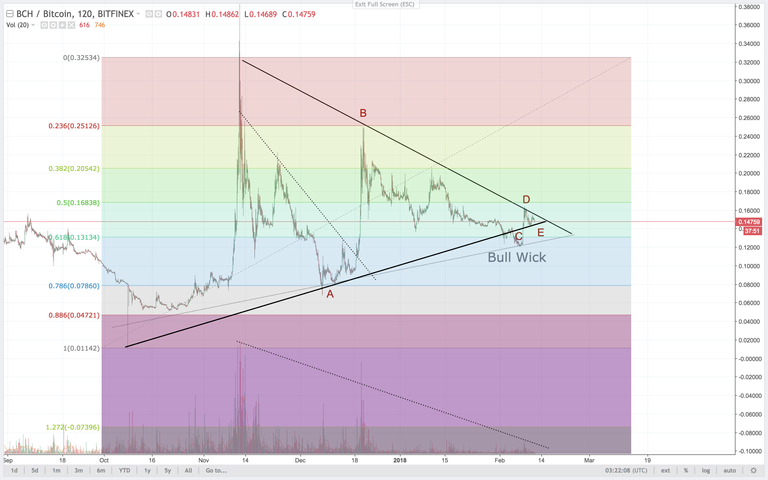
My primary count remains as shown below. A leading diagonal counted as 1,2,3,4,5. I believe that price could have bottomed with the recent Bull Wick spike below the lower wedge line which was promptly retraced back inside. Since then, price has breached the upper wedge line and remains above it. The second above white line connects the highest two peaks and represents a resistance, should price continue rising to higher highs.
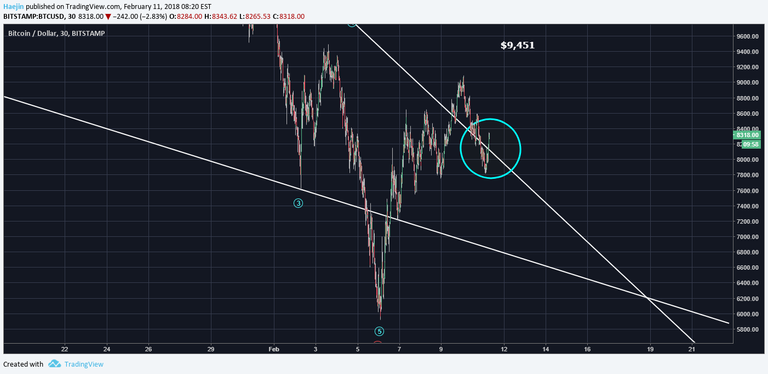
The below close up shows that overnight price action briefly pierced downward through the upper wedge line but was quickly retraced. These kind of price actions are quite common where price hops around a major support/resistance line. Similar to the Bull Wick, this is another way of depleting the weak hands. My primary count remains that price should see higher highs; lest the wedge support line be broken decisively.
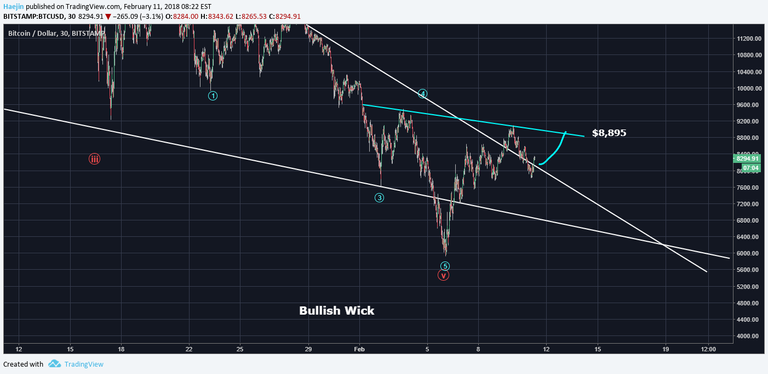
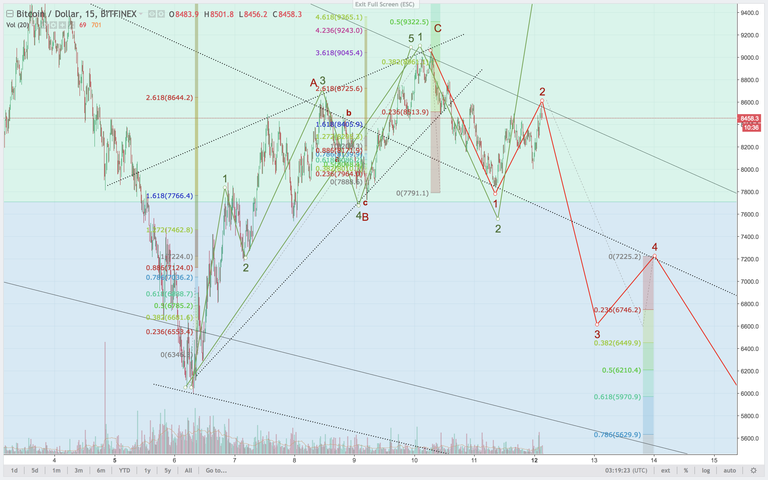
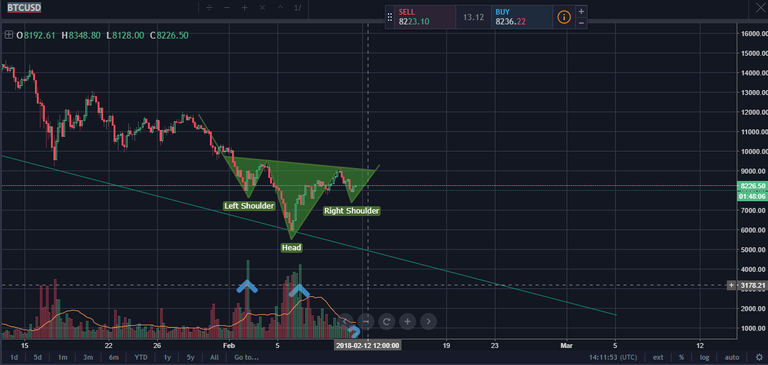
The Head & Shoulders pattern remains and with the current developing bounce, the Right Shoulder could complete. I've slanted the Neck Line (blue) downwards to the right. This thus changes the upper high target from $9,451 to $8,895. No significant difference.
Legal Disclaimer: This is only my opinion, make of it what you wish. What does this mean? It means it's not advice nor recommendation to either buy or sell anything! It's only meant for use as informative or entertainment purposes.
Please consider reviewing these Tutorials on:
Elliott Wave Counting Tutorial #1
Elliott Wave Counting Tutorial #2
Elliott Wave Counting Tutorial #3
Laddering and Buy/Sell Setups.
Laddering Example with EOS
Tutorial on the use of Fibonacci & Elliott Waves
@haejin's Trading Nuggets
Essay: Is Technical Analysis a Quantum Event?
Follow me on Twitter for Real Time Alerts!!
Follow me on StockTwits for UpDates!!
--
--

If this blog post has entertained or helped you to profit, please follow, upvote, resteem and/or consider buying me a beer:
BTC Wallet - 1HMFpq4tC7a2acpjD45hCT4WqPNHXcqpof
ETH Wallet - 0x1Ab87962dD59BBfFe33819772C950F0B38554030
LTC Wallet - LecCNCzkt4vjVq2i3bgYiebmr9GbYo6FQf

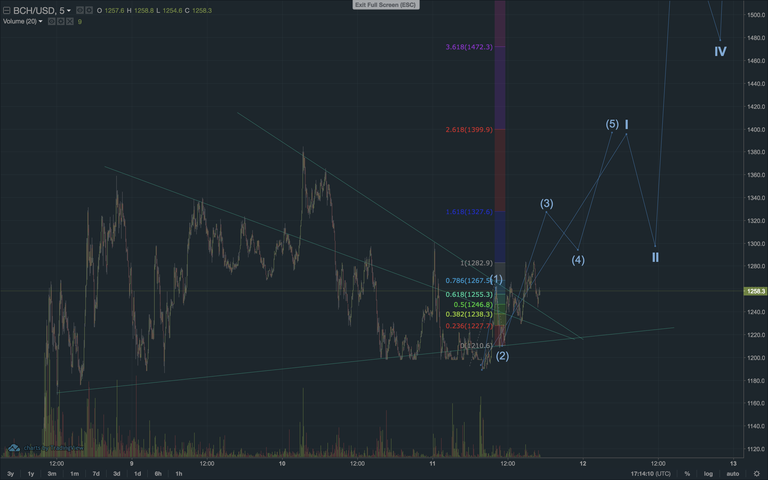
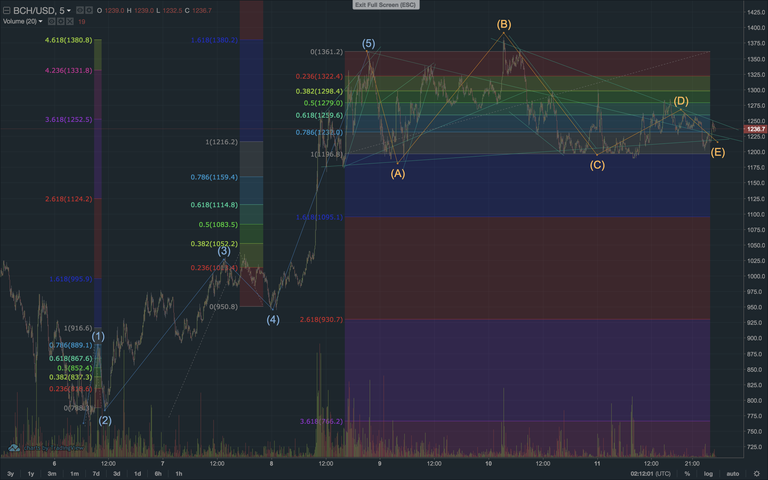
BCH/USD
hey, sorry to bother you. What happens when I click redeem rewards?
where does it go?
does it make my upvote power go up?
does it get converted into SP?
I have no clue lol.
Or is it best to leave it there?
Do it, do it.
Right Now!
Hit the button.
BTC/USD Coinbase
That is still the primary count
are you using the fib extension to see how low they will go?
what are those first two fib tools? Extension or retracement?
it looks like you clicked the top of wave 0 then bottom of wave 1 then top of wave 2... you can use the extension on a 1-2-3-4-5 going down?
Why not use retracemnt tool?
I got a lot to learn lol
Trend-Based Fib Extension
wave 3 is 1.27 x wave 1
wave 5 is 1.27 x wave 3
Can you explain this?
Start here
https://steemit.com/bitcoin/@haejin/elliott-wave-tutorial-1-by-haejin
https://steemit.com/bitcoin/@haejin/tutorial-on-the-use-of-fibonacci-ratio-and-elliott-waves
BCH/USD
thank you
BCH/BTC
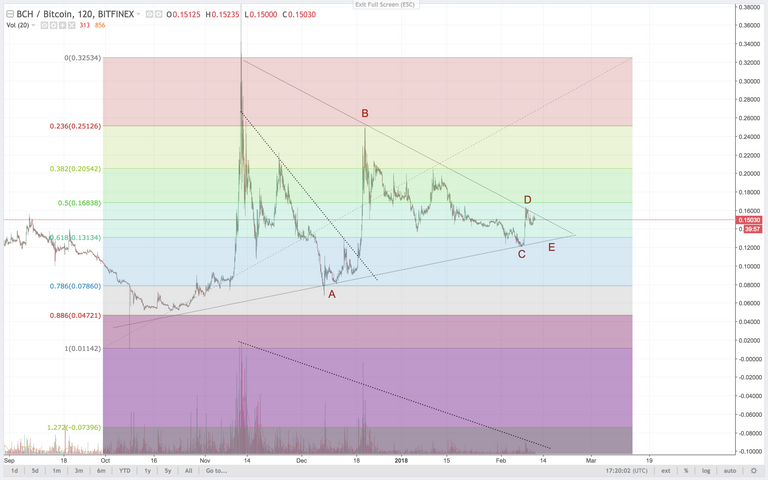
Good to see it trending up. As long as we see volatility in the stock markets, that should be great for cryptos.
FIRST!!!!
GREAT!!! 😂
I think I beat you player😃👍
Nope
Nope you won by 2 mins
lol are you talking to me?
Yes
lol, im too fast buddy
You are👍😃
R.I.P 🙏🏽
Get a life.
you
Just go on! 👏🙃
lol
xD
Why Cryptocurrency Investing is a Terrible Idea WARNING: ONLY READ IF 18+ AND ABLE TO HANDLE THE TRUTH... GRAPHIC LANGUAGE USED https://steemit.com/bitcoin/@investingtips/why-cryptocurrency-investing-is-a-terrible-idea-warning-18-only-graphic-language-used
I think this is not Leading diagonal.
Leading diagonal rules:
Diagonals are always 5 wave structures.
Structure = 3-3-3-3-3 or 5-3-3-3-3
Leading Diagonals happen in Wave 1 of an Impulse or Wave A of a ZigZag.
Wave 2 & 4 always subdivide in ZigZag corrections.
Wave 2 Never moves beyond origin of Wave 1.
Wave 3 must go beyond Wave 1.
Wave 4 must move into wave 1 range but not beyond Wave 2.
Wave 5 must go beyond Wave 3, there should be no "Truncation".
In Contracting Diagonals, Wave 3 is always shorter than Wave 1, Wave 4 Shorter than Wave 2, and Wave 5 shorter than Wave 3.
In Expanding Diagonals, Wave 3 is always longer than Wave 1, Wave 4 longer than Wave 2, and Wave 5 longer than Wave 3.
Your wave 5 has 5 waves. and the rule is that should have 3.
We can maybe mark it other way to make a case for ABC in the 5th wave.
Also wave 3 is longer than wave 1. (for 3%) :)
Also, the rule is that it can only happen in wave 1 of an impulse or A of ABC that we will still have waves B and C, and that can take a long time to finish.
I think it's Zig Zag with one more lower low to make and that we are done with correction.
Solid. Got charts?
https://www.tradingview.com/x/87JwVwmV/
BTC/USD
Out of steam
BCH/BTC
I think that that's a possibility. It would then look like the 2001-2002 dot com correction.
First
Thoughts on this Haejin? the books are great by the way champ. Keep up the great work.
Yes, the H&S inverted would be bullis finish off to this correction!
Thanks, really appreciate it.
As I said before if someone read my comments on heijin post,
In Feb 10 it will rise... It rised now I day on march 15 it will touch 12+ btc.... Trust my words wait and watch
Love it!
Thanks
Can I get a up vote?
lol, how about 3? I got you brotha!
The only reason why BTC drop hard and lost the primary leading diagonal was because of the FUD, so would it be wrong to say that in the next bullish move the elliot waves might show a pattern a little higher than this?
@Haejin, I see the last mini correction directly at the upper wedge line!
Your post very good
https://discord.gg/NU3gJG2
What is the Next Upper Support? Any Suggestions?
Good post
thanks for sharing it
Good post,,
interesting . steady
The way you draw the down trendline ( ii , iv, 2 , 4 ), yes it was breached. But at number 2 blue, you made the trendline touch below the top, not at the top? Why is that? If you adjust it to the top, then we did not breached. Could you please clarify why you draw the trendline like that?
I am wondering the same thing!
I've also wondered why the trendlines don't sit on top of the peaks.
please up vote my comment...ill send bobs
Nice analysis! Thanks!
There is very less probability according to technical analysis for bitcoin and altcoins to shoot up from this level. Another drop equivalent to previous low is expected.
I concur kind sir
Thank you and enjoy your trip
To my knowledge this longer period of decline. instead downs till half. what do you think?
Always entertaining and informative. I do have a couple of critical questions to help in my understanding. First, I have always understood that a head and shoulders pattern is a bearish sign showing a short-term top but you seem to suggest that BTC, while entering this pattern could break out. Am I misunderstanding your assertions? Are you simply pointing out the formation of a possible head and shoulders which would be short term bearish? Please explain. Also on a more general note I am curious to know if and how you personally apply your expertise in charting to your own benefits? Are you making trades based on your work and, would you be willing to share your buy and sell timing as a further legitimization of your work?
an inverted head & shoulders is bullish
nice post
intersting part
Wow!! So comfortable message!! I think many week hands left. I expect this week!!
Nice man :)
https://steemit.com/@michaliocze
your folow has been returned ;)
Article Summury: Higher high is coming.
So you’re telling us there’s a resistance line from the two highest highs in the correction? Sorry, human nature, trends, and the volume of bitcoin do not agree with your years of experience. Love your analysis on videos, but i disagree on this one.
Head and shoulders pattern on what time line? Is it hourly or daily? Because if the right shoulder forms completely, we are in for a dip
Hopefully we will get some volume to confirm that right shoulder. Not looking good right now
teşekkürler
Everyone please stop feeding haejin money! if you say that ten coins will rise a day obviously your going to get a few hits in this lucrative market. He makes multiple posts a day accumulating over 300 dollars a post. We need to stop feeding him money because all he does is decimate the reward pool and doesnt care about steemit or steemians! NO MORE HAEJIN
Haejin, you are now literally spewing nonsense every day about bitcoin. Stop misleading people with your bullish lunacies. Your graph is extremely wrong with multiple points far from the wedge itself. Short term bitcoin is bearish and there are NO indications of a breakout, as the volume is incredibly small since the last low of 6k.
End this stupid nonsense! Stop cash-cowing steemit users, they are NOT your sheeple.
You are the one spewing nonsense. If you know better show people your chartwork. Or better still go and play with yourself. People who follow @haejin aren't really interested in what you have to say. TROLL much?
@charliek You can only talk about yourself with that. people that follow @Haejin (not blindly) do want to share good input from others like @garett 's valid points in the counter response he gave you below. If you want different charts, check @philakonecrypto and even Tone Vays videos today show his bullishness melting down. Blessings.
the price never left the wedge, barely wicking it yesterday. if you had any intellect left, you would have noticed Haejin switched from this wedge drawing (mine) to his current version only a few days ago, IMAGINING a breakout, while the volume is hitting lower lows each and every day.
Sheeple will be sheeple.
I would prefer to see comments like this, instead of your previous one.
I'm wondering the same about the wedge. But I think it's possible that it was bear wick at point 2 and even at point 0. It's hard to say what is correct here.
Go to 30 or 60m charts. You can't connect points 0,2,4 on you chart. So BTC did left the wedge at some point.
Exactly
https://discord.gg/NU3gJG2
Garret, you are correct. This is textbook bearishness. A brief rise followed by low volume leads to further bearish prices. Do not buy at this point, folks. Wait for another big drop.
Actually, if you had been following you would have noticed that where his upper line is now is exactly where it was to start. He had moved it out because of the sideways movement at the top of the D wave, but after a few days decided that there was better support at his original line.