SUMMARY
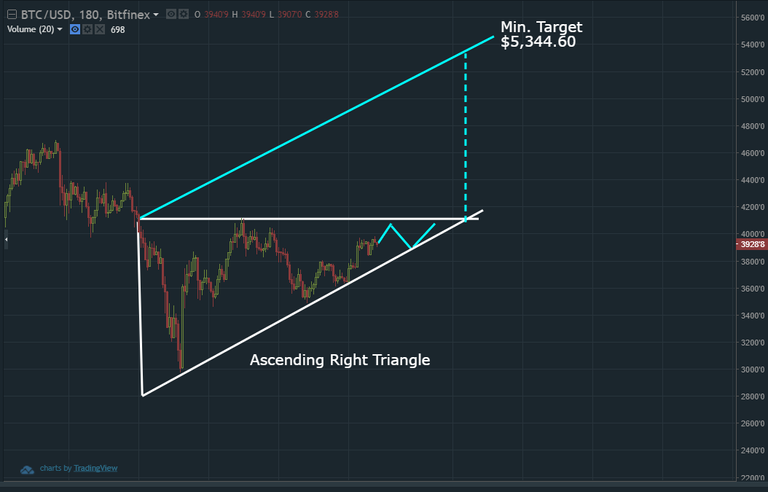
A thought experiment to identify a new Chart Pattern for Bitcoin. Check it out in this video!
This way:
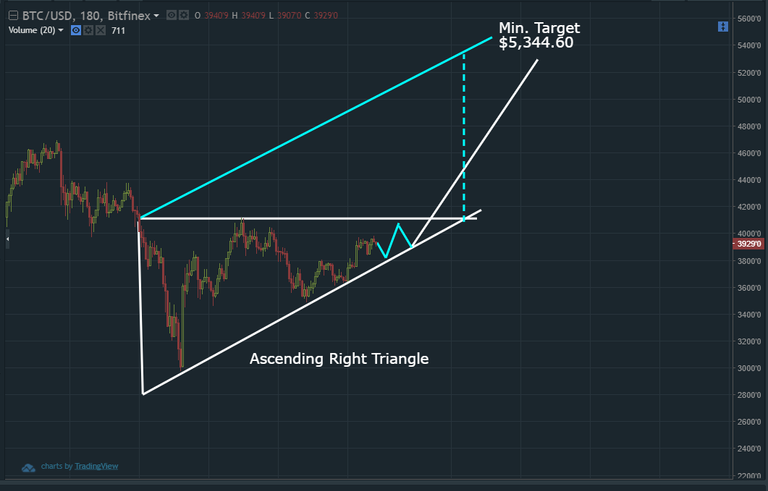
Or this way, with a slight down to support first, then up:
If this blog post has entertained or helped you to profit, please follow, upvote, resteem and/or consider buying me a beer:
BTC Wallet - 19gHMJc9wi9KkP47wokz8y4cFNgz1kAAUE
ETH Wallet - 0xf83641dbf1a53498eae6d0d568c969790da48a36
LTC Wallet - LU1mEw1LHvffoWf9VDEVdP7Day4jv6VLqu
EOS Wallet - 0xf83641dbf1a53498eae6d0d568c969790da48a36
Legal Mumbo Jumbo: This is only my opinion, make of it what you wish. What does this mean? It means it's not advice nor recommendation to either buy or sell anything! It's only meant for use as informative or entertainment purposes.
Chart analysis is a bit like guessing roulette numbers.
It's an art. Same as music, poetry or any other endeavor. It takes tonnages of failure experiences to become good at it.
It's like someone who wants to learn how to play the piano. They might learn music theory or read about it and when they actually sit at the piano and try to play....they suck. That's because in this world, nothing gets good without practice and tonns of practice.
For TA, the practice is in real live money losing/winning applications. My rate is about 88% and that's after 15+ years of practicing.
Well said my friend
I agree Haejin has proved TA allows you to peak around the corner to see what might happen - oh and Haejin is a master at it !
You still did not call the bottom of wave 4.
Are you more bullish than 3 days ago?
I wanted so bad to be able to buy close to 2500, so I've been waiting for more bear action it looks like it is not going to happen. More and more bearish players are turning bullish.
This is what I am wondering, too.
I think we all did ! If it breaks up from
Here just ladder in because if it's reaches 7000-9000 you'll still be laughing !
Thank you for your thoughts Haejin. I learn a lot from it.
I was wondering what do you think of today's volumes? We could see some nice moves upwards intending to reach the 4.000 several times, but the volume remains really low and make me wonder!
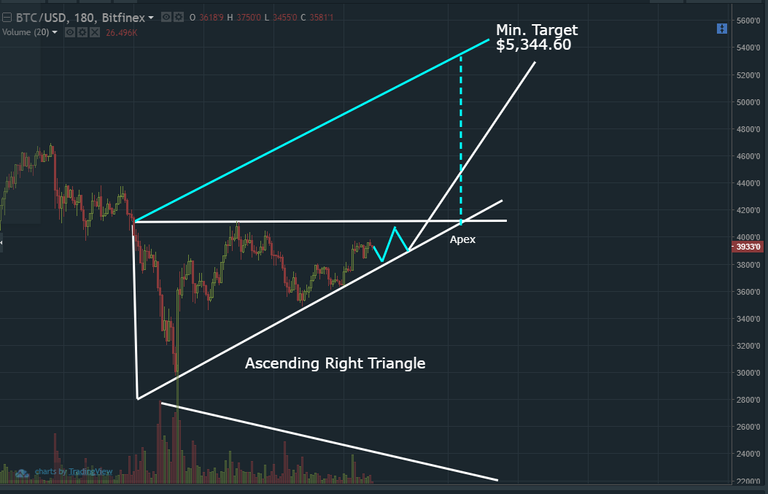
If this chart pattern for ascending right triangle bullish is right, the volume will go to trickle as prices get closer to the apex. And then explode up! Let's see what happens.
Really nice explanation, I'll keep an eye on it! Thanks :)
So...from my best interpretation...before triangle completed...has to break past $4,000 upward first before anything else can happen on this triangle ...so far today can't seem to climb past that...thanks.
A formidable resistance. The dip to the white support should help.
Don't know how often you can do updates...I know a lot of us are onto NEO...from your last analysis...I got sense would break up close to $34...drop back down...then do its sky rocket...look forward to any update..thanks again.
Beautiful golf weather here on east coast...wish I could sneak out...