
SUMMARY
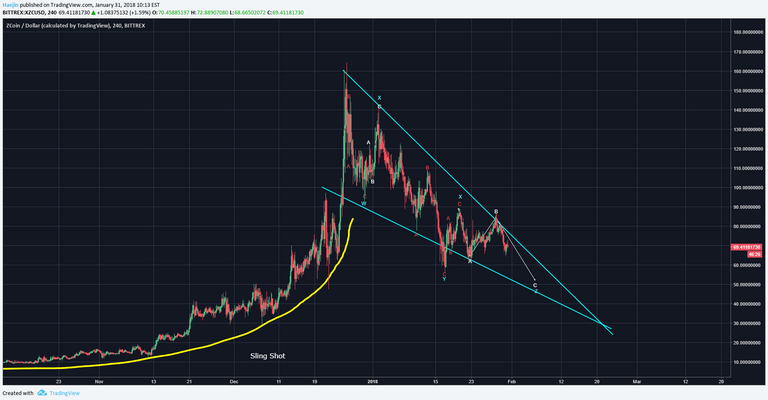
ZCOIN (XZC) is imitating Bitcoin's correction mode. Not with exact like for like; but rather, sentiment which reflects a similar pattern. It's likely also that many holders of BTC are also holding ZCoin. The downward pointing symmetrical triangle, while not exactly a leading diagonal type, is expected to have one more lower low. When price gets closer to the apex; the state of being sellerless does arrive. This would be an attribute of a corrective bottom.
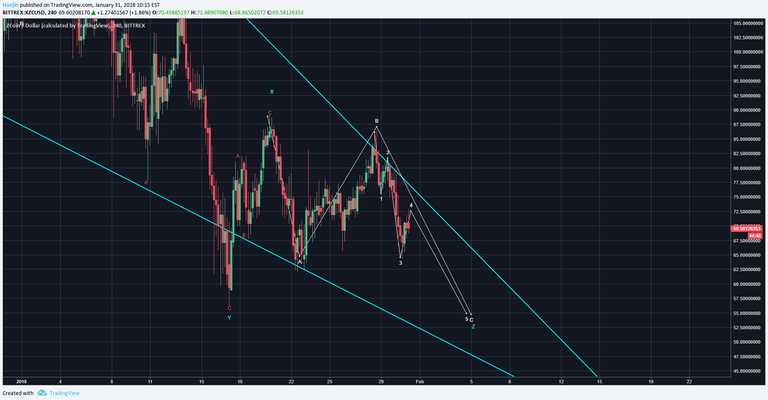
A magnified view allows subwave counting that provides a better "geo" positioning of the Elliott Waves. If the one more lower low is in progress, the white waves 1,2,3,4,5 will allow a pathway towards $54 or so. Would I cast a buy ladder in this zone? It's already set!
Legal Disclaimer: This is only my opinion, make of it what you wish. What does this mean? It means it's not advice nor recommendation to either buy or sell anything! It's only meant for use as informative or entertainment purposes.
Please consider reviewing these Tutorials on:
Elliott Wave Counting Tutorial #1
Elliott Wave Counting Tutorial #2
Elliott Wave Counting Tutorial #3
Laddering and Buy/Sell Setups.
Laddering Example with EOS
Tutorial on the use of Fibonacci & Elliott Waves
@haejin's Trading Nuggets
Essay: Is Technical Analysis a Quantum Event?
Follow me on Twitter for Real Time Alerts!!
Follow me on StockTwits for UpDates!!
--
--

If this blog post has entertained or helped you to profit, please follow, upvote, resteem and/or consider buying me a beer:
BTC Wallet - 1HMFpq4tC7a2acpjD45hCT4WqPNHXcqpof
ETH Wallet - 0x1Ab87962dD59BBfFe33819772C950F0B38554030
LTC Wallet - LecCNCzkt4vjVq2i3bgYiebmr9GbYo6FQf

great move so we need to be away from this pair at the moment thanks @haejin
Last time you posted about Zcoin you predict it's price to sky rocket to $500+. Now this graph states it going down, Now this is just a question for future references. But is that older graph no longer valid? or is this suppose to happen after Feb. passes? If you could clarify that would be great @haejin :)
That's NOT what he wrote.
https://steemit.com/zcoin/@haejin/zcoin-xzc-needs-to-breach-the-upper-white-line
June! is the month thats what I didn't remember correctly. We're in wave 2 and the 500$+ is set for wave 3.
Time is not a factor you can calculate with TA.
He's just drawing on the chart for future, potential values.
His original TA still holds, the correction depicted is currently completing. The higher targets remain unchanged.
This information can improve your trading profitability: https://steemit.com/bitcoin/@investingtips/which-trading-order-should-you-choose-all-the-different-types-explained
@asiahajranajma You're wrong. In his post from 12 days ago, he clearly showed that the price was still correcting, and could therefore go lower. The larger degree of trend, as Haejin clearly wrote, remained solid. He was showing the trend, in accordance with Fibonacci relationships. With this post, he's showing the correction as it unfolds. I'd prefer that those who post crap on Haejin's blog either (a) learn to read, especially the disclaimer at the bottom of each of Haejin's posts, or (b) simply mute Haejin and move along. Pretty simple, eh?
good i hate Zcoin!
good advice
I follow you constantly
Great opinion
What are your thoughts on the upcoming zclassic snap shot for bitcoin private?
I will wait and positioning on the right path!
Thanks!
I am not sure if I will join this coin, but thanks for the advice.
Are you High on Magic Mushrooms Haejin?
can you like me and vote me
https://steemit.com/photography/@rafeelkhan/myself
Tiene bastante potencial. Aunque con el tiempo se sabra hasta donde es posible llegar
pls pray and vote for my dad
https://steemit.com/pray/@hamzasb/pray-for-my-dad
Very nice!
If you are receiving this message, you have been flagged for responding to a known scammy piece of shit. Enjoy your dwindling rep. Here is how @haejin supports the community.
P.S. - His 21k followers are complete bullshit and most are inactive and have been for months.