Bitcoin has retraced almost 15% of its gain in recent months, going down from its all time high price @ $64899 to $51536 (CoinBase' prices) and now it's around $56K
looking through the Moving Average Glass:
I use a set of fractal multi-time frame exponential moving averages as below:
EMA 12, 21, 48 and 192
EMA 12 is associated with weekly time frame,
EMA 21 and 48 for the Daily
EMA 192 for the 4H chart
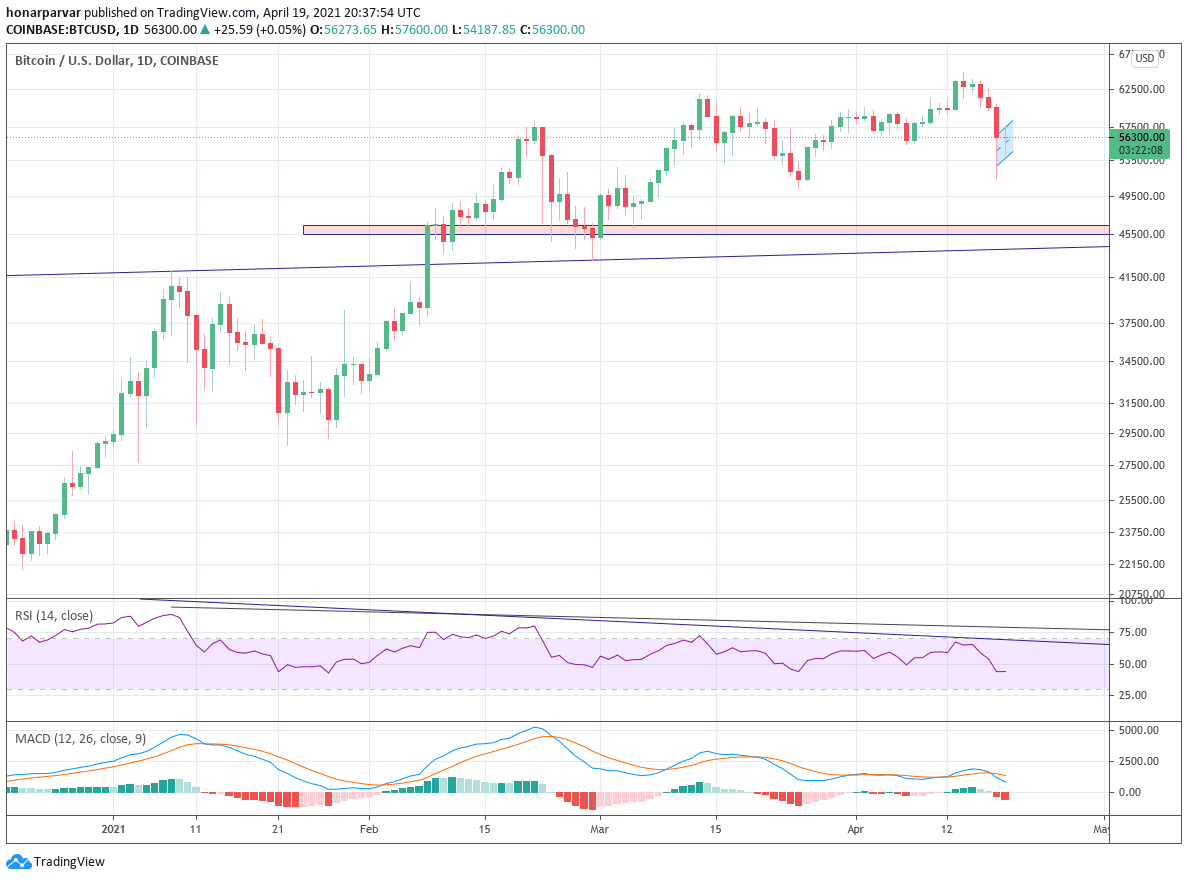
in the weekly TF we are still above EMA12 currently @ $51857
in the Daily TF, we are below 21 and above 48
in the 4 hour TF we are below EMA 192 currently @ $57860
to explain this, I prefer to point to a flag pattern for BTC below:
in the 1 hour chart it's clearer:
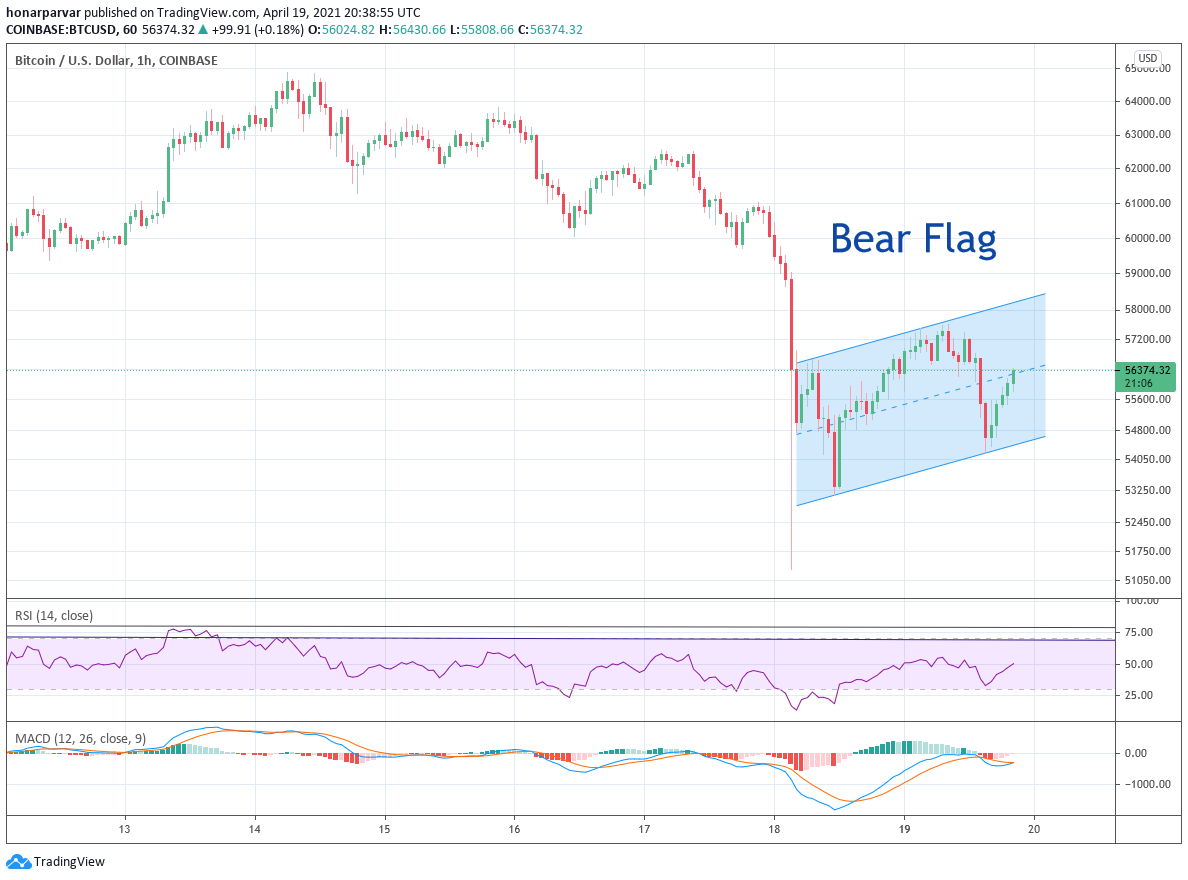
this pattern along with the EMA numbers shows me the probability of more downward move. I know many don't like to hear that from anyone, but the probability for more correction is higher than going back to test a new All time high and keeping on growing.
still, it's not a certain thing! it's a probability; though higher, yet the other side is also probable, less probable in my humble opinion.