Forecast for the BTCUSD pair, applying the recent information about SK-FX trading strategy.
In this post, I applied: all-round view of the market, analysis of the market balance level, oscillator analysis, Fibonacci levels analysis.
Dear friends,
Monday, 16.04.2018 has started a new week, so, it is time to sum up last week’s results and to identify the targets for this one. In the BTCUSD weekly timeframe, there new candlestick has emerged, which gives us food for thought and the reasons to update the forecast.
I have described SK-FX strategy recently. In this forecast, I will apply the new material to practice the theory and to better understand the trading strategy. To understand, what I'm going to talk about, I recommend to get familiar with the article here
SK-FX strategy developer doesn’t share exact data for indicators settings; I adjusted the customs myself, based on the sources found and my own experience. At the same time, the original SK-FX strategy settings can significantly differ from the indicators used.
The main idea of SK-FX trading strategy is that the market is a self-regulated system that constantly seeks the equilibrium point, demand and supply balance for an asset.
Our main trading objective is to find out the balance point and identify the level, the ticker currently is.
Knowing points A and B, we make up a rout map how to get to the destination.
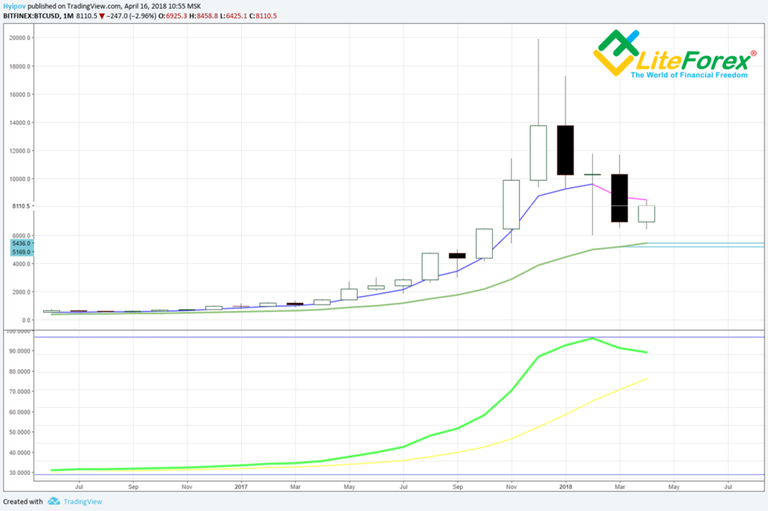
To identify point B, have a look at Bitcoin monthly chart.
 The balance point in our case is identified by 21-bar moving average, applied to close levels. Here, we need to take into account that this target is dynamic; and, after a new bar emerges, the last moving average value will be re calculated. Last month, this value was equal to 5 169 USD, currently, its value is at the level of about 5 700 USD. As this target is long term, it can well be so that the real point of price meeting the equilibrium level is around this price zone. However, the fact that the price will reach the balance level is SK-FX strategy fundamental principle. The market always seeks a balance point! Following this principle, we can safely set the target at the level of about 6 000 USD, making adjustments for FOMO and the psychological importance of this level.
Now, find out point A, that is the perfect entry point with maximum profits.
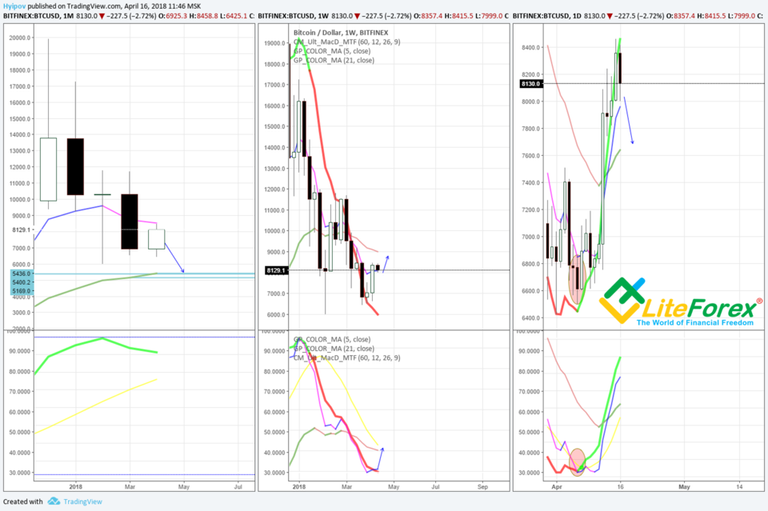
To do it, we need to analyze shorter mainframes, so as to understand, what logic the market will be based on. As we see in the chart above, in the middle, the market is below the balance level, The last strong candlestick allows us to hope for reaching the balance point at the level of about 9000 USD within this week. The possibility of such growth is confirmed by the fact that the fast MACD and the short moving average is close to the window bottom border.
In the daily chart, on the left, we see that indicators are in bullish state. Neither fast MACD, nor the short moving average haven’t reached the window top border, thus, retaining the potential for inertial growth.
Nevertheless, there is already a gap between the current price level and the balance point in the daily chart; therefore, bullish market will tend to reverse down to the level of 7 600 USD.
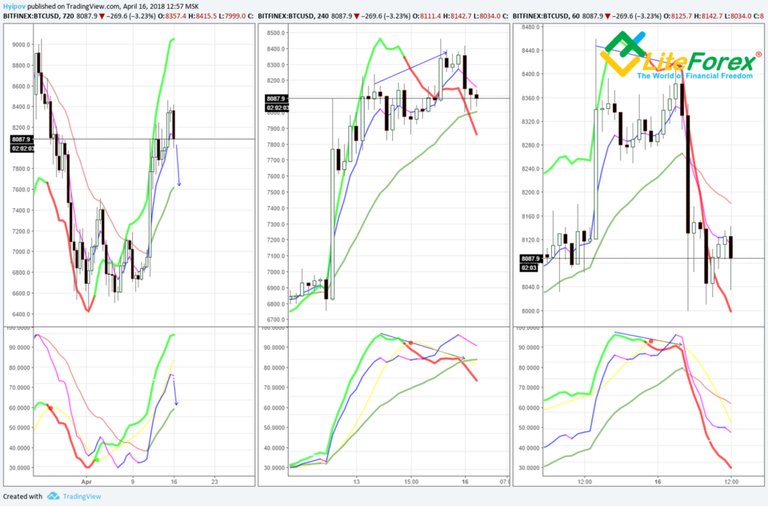
Studying the shorter timeframes of hours, we see the following situation:
In 12-hour chart (on the left), MACD and the moving average reached the top of the window; the short and the long moving average indicate a wide gap with the potential for the decrease down to the equilibrium level in this timeframe, at about 7 600 USD.
In 4-hour chart, (on the right), MACD indicates divergence in the ascending move. The balance pont of this timeframe is at the level of about 8 000 USD.
In the hourly chart (on the right), the ticker is below the equilibrium point, at about 8 200; therefore, the price is still likely to be corrected up to this level. In addition, the short MACD is approaching the window bottom, which indicates a relatively soon possibility of the price retracement.
To make any forecasts, this market analysis is not enough. There is a sense in studying the minute-charts only looking for a maximum profitable entry point.
What do we finally have?
Finally, we need to sum up all the information from the timeframes studied. To it, I suggest adding all the above trends to two-hour chart.
Blue arrow is the target of the monthly timeframe,
Purple arrow – for the weekly one,
Green is for the daily and 12-hour timeframes (I didn’t separated, as the market targets coincide)
For 4-hour chart, there is yet no target, as, currently, it is in the timeframe balance zone.
In the hourly chart, there are emerging the first signs of the price upward retracement:
Finally, having applied Fibonacci levels and combined all the points suggested, I have the following scenario:
The most likely short-term target is the level of 9 000 USD. It can well be reached within this target. However, due to the indication in the hour-charts, we understand that the price is highly likely to be corrected into the range of 7 600 7 800 USD, before it starts to rise. Therefore, we should look for an ideal point to enter a short trade, with the above target, in the zone around 9000. The minute-charts will help us identify the point n future.
In case the price reaches level 9000, one of the promising correction patterns will be a possible Head and Shoulders patter. However, I should note that it is a kind of assumption. For relevant targets, we need to monitor the situation and update the forecast every week.
All the indicated levels are dynamic and when new bars appear, they will change; and so, the forecast itself and the trading targets need regular revising and updating.
I would also like to emphasize that this forecast is based solely on the material, I published myself with the application of SK-FX strategy to demonstrate how the projections are made.
As I adjusted the indicators myself, based on my own experience and the information, found on the Internet, I don’t recommend complete copying my adjustment of the trading strategy to avoid the mistakes, I could have made in my personal trading strategy. I’s sure, only joint, collective work will provide the best development of this strategy and the ideal combination of the indicators, and their setting, which will be the most efficient.
The forecast updating and a more detailed study of the strategy itself will be in a week.
Looking forward to your subscription, comments and reposting.
I wish you good luck and good profits!
Regards,
Mikhail @Hyipov by liteforex.com
If you liked the article, support the author and his project, subscribe to @hyipov and @hyipi
Your support is very important to me!
The original of my article is available at liteforex.com
Disclaimer: No information presented in this article is a guarantee of obtaining a certain return on investment as well as a guarantee of stability in the amount of possible costs associated with such investments. Materials should not be considered as informing about possible benefits. A certain profitability in the past is not a guarantee of profitability in the future. The responsibility for making an investment decision as well as the risks of losses each takes on itself.


Great analyze
Thanks :)
Congratulations @hyipi! You have completed some achievement on Steemit and have been rewarded with new badge(s) :
Click on any badge to view your own Board of Honor on SteemitBoard.
For more information about SteemitBoard, click here
If you no longer want to receive notifications, reply to this comment with the word
STOPCongratulations @hyipi! You have completed some achievement on Steemit and have been rewarded with new badge(s) :
Click on any badge to view your Board of Honor.
For more information about SteemitBoard, click here
If you no longer want to receive notifications, reply to this comment with the word
STOPDo not miss the last announcement from @steemitboard!