FOREWORD
In this thread, i would try with the best of my knowledge to explain the following questions as easily and briefly as possible.
1. What is divergence?
2. What are different types of divergences?
3. What is their importance?
WHAT IS DIVERGENCE?
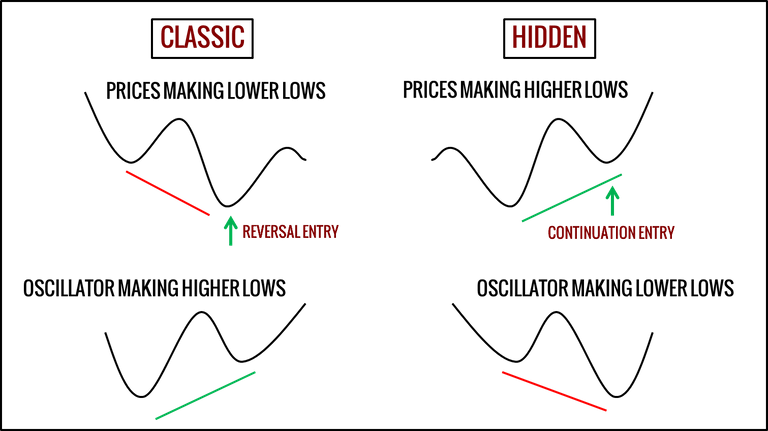
Disagreement between the indicator and price is called divergence i.e when the price is moving in one direction but the oscillator is moving in the other, it is called divergence.
WHAT IS THE IMPORTANCE OF DIVERGENCES?
Divergences have significant implications for trade management. A divergence can be used to take up/sell off a position. For example, if you are able to spot a bullish divergence early, then you be able to take up a long position at a good entry point. Or if you spot a bearish divergence then you may close out your longs at a good exit point or may take up some shorts.
There are two types of divergences:
- Regular divergence
- Hidden divergence
REGULAR BULLISH:
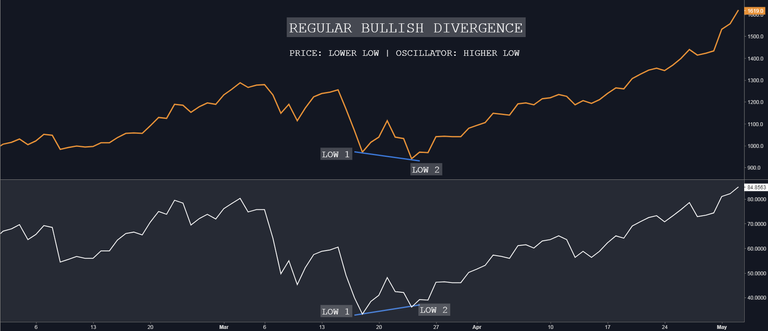
Indicates underlying strength. It marks the exhaustion of Bears. It’s an indication of possible trend direction change from downtrend to uptrend. In the chart above, you can see that the price is making a lower low(Low 1 > Low 2) while the oscillator is making a higher low(Low 1 < Low 2).
REGULAR BEARISH:
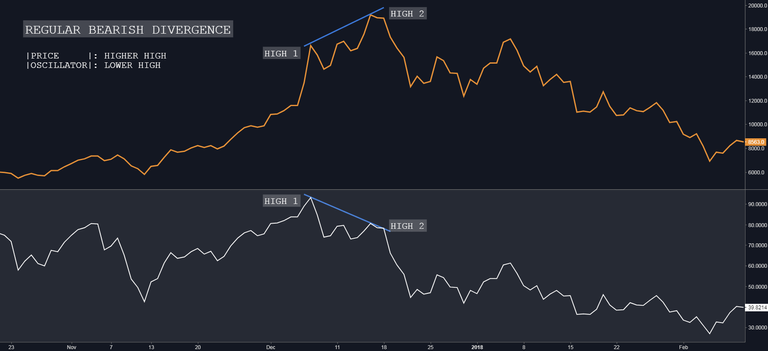
Indicates underlying weakness. It marks the exhaustion of Bulls. It’s an indication of possible trend direction change from uptrend to downtrend. In the chart above, you can see that the price is making a Higher High(High 1 < High 2) while the oscillator is making a Lower High(High 1 > High 2).
HIDDEN BULLISH:
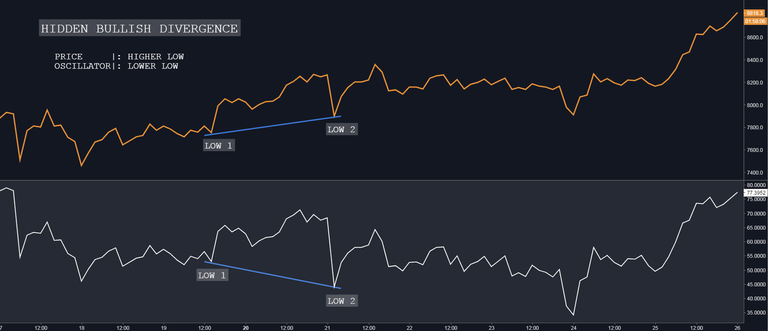
Indicates underlying strength. It occurs during retracements in an uptrend. Nice to see during price retest of previous lows. It’s good entry point for opening new positions or add to the existing positions. In the chart above, you can see the that the price is making a higher low(Low 1 < Low 2) while the oscillator is making a lower low(Low 1 > Low 2).
HIDDEN BEARISH:
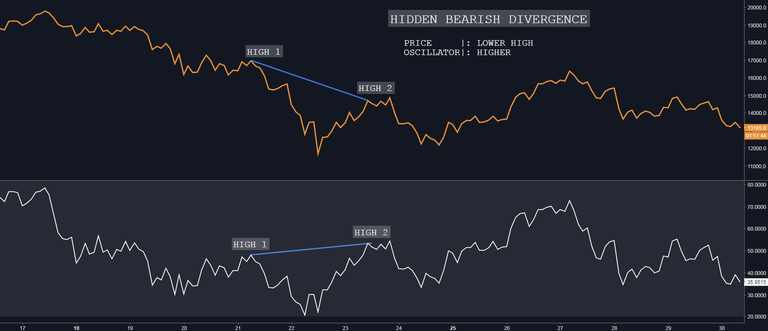
Indicates underlying weakness. Found during retracements in a downtrend. Nice to see during price retests of previous highs. It’s a good exit point for longs and a good entry point for shorts. In the chart above, you can see the that the price is making a lower high(High 1 > High 2) while the oscillator is making a higher high(High 1 < High 2).
So, this is it from my side. I hope my explanation and charts were neat enough to give you a good glimpse of the divergences. Do get back to me with any questions or comments, would love to hear from your guys. Also, if you find this article/information helpful, be sure to leave an upvote and share it with all your friends.
Congratulations @imfamousrajat! You received a personal award!
Click here to view your Board of Honor
Do not miss the last post from @steemitboard:
Congratulations @imfamousrajat! You received a personal award!
You can view your badges on your Steem Board and compare to others on the Steem Ranking
Vote for @Steemitboard as a witness to get one more award and increased upvotes!