
A potential double bottom may be forming on SC-BTC chart. This may or may not play out since it is too soon to call out the pattern. Just wanted to post this so that you guys can keep an eye on this one.!
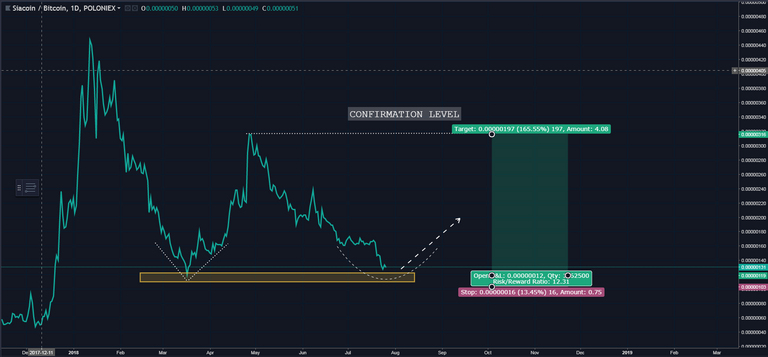
The Risk/Reward ratio is too big on this trade, roughly around 12. If this plays out, it can be a really huge trade.
Take care to use proper stop loss. I am posting my setup below.
PATTERN: ADAM & EVE DOUBLE BOTTOM
TIME FRAME: DAILY
RSI:
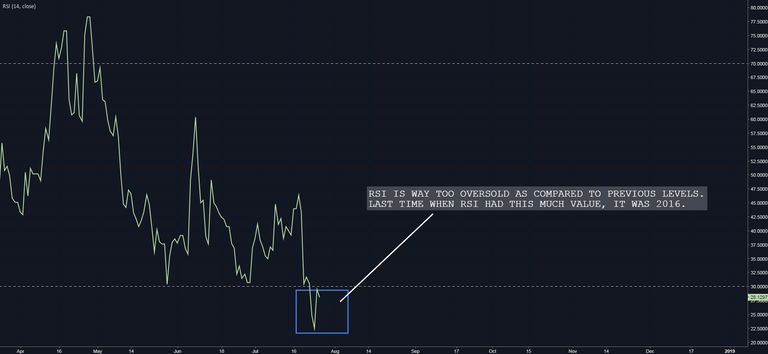
The RSI is currently in oversold region. What's interesting is that RSI has never reached this level since 2016. So, when it touched 22.5 level it rebounded strictly because of the buying pressure. At the moment, it is around 28.
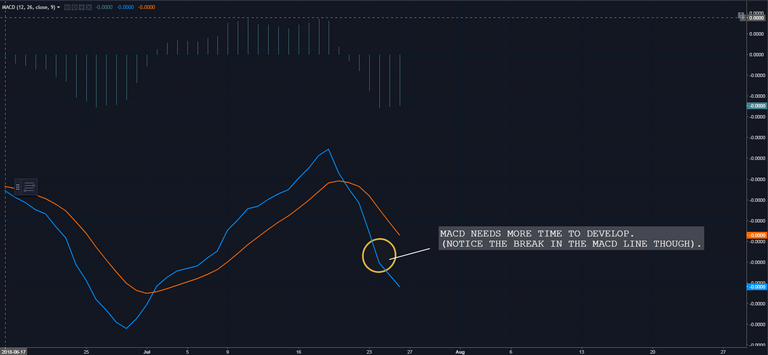
MACD
There is Bullish divergence on the longer time frame of MACD too. It just needs more time to develop.
MOMENTUM
There is Bullish divergence on the momentum indicator too with the price forming lower low but the momentum forming higher low.
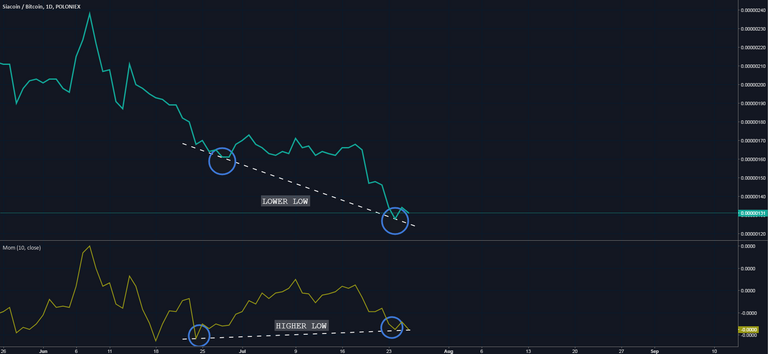
Trend is expected to reverse soon, from downtrend to uptrend. This may be a good time to start accumulating.
P.S: This is not an investment advice. This is for learning purposes only. This is my personal journal. Invest your capital at your own risk.
Keep an eye out. Trade safely. Always remember, money not lost is also a profit.
Good luck trading.!
Peace.