Bitcoin and the cryptocurrency market has experience a big run up since the announcement of futures. Here are some of the updates that will be implemented for the rest of the year.
United Bitcoin Fork 12/11
Bitcoin Platinum (SCAM) 12/12
Super Bitcoin for Smart Contracts 12/17
CBOE Block Trades 12/17
CME Group Futures Launch 12/18
Lightning Bitcoin Hard Fork 12/23
Bitcoin God Fork 12/25
Bitcoin God Airdrop for Bytom holders (BTM) 12/25
Bitcoin Diamond Mainnet + Wallet 12/31
Bitcoin Uranium 12/31
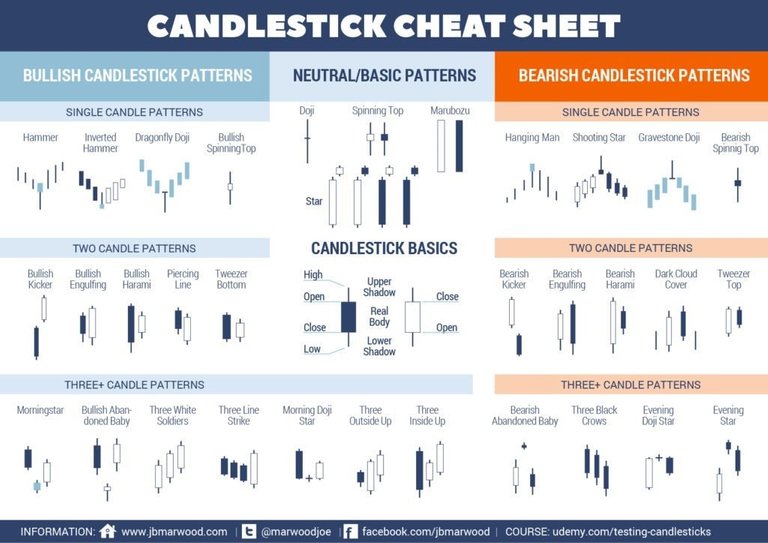
Here is the very helpful chart of candlestick patterns with terms that will be used.
Possible Price Movements and Analysis
Bitfinex Chart
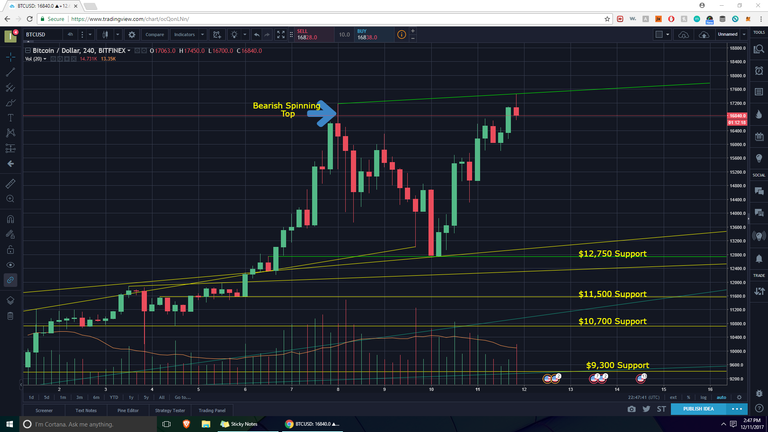
After a big bull run, a pullback was inevitable. A level of uncertainty from the launching of futures may have caused traders to take profits for security is a possible explanation. Bitcoin is forming its second mountain with the latest candle also indicating a bearish spinning top with a higher upper shadow compared to the first mountain. This indicates price action could continue to increase. Major support levels are labeled as shown.
Lookout for different prices, charts, and indicators from different exchanges. I generally use Bitfinex since it has almost twice the trading volume. The second mountain of the Gdax chart has not yet eclipsed the first mountain since Gdax has a very tall upper shadow hitting a high of $19,697.
If Bull Run Continues
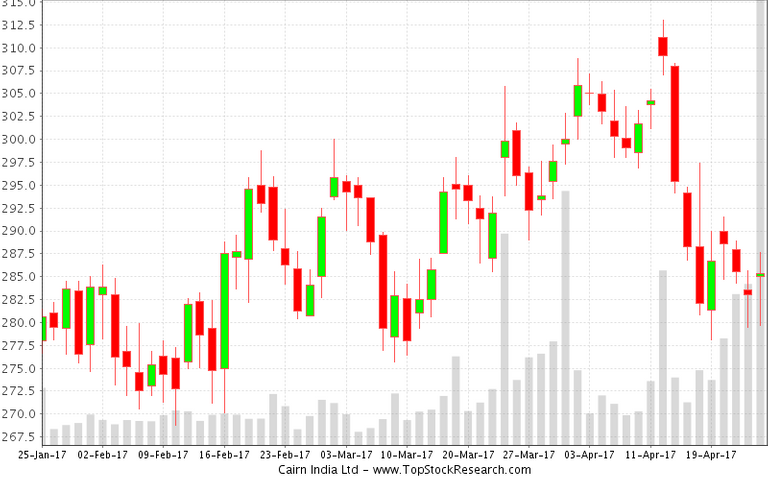
With major updates launching soon, the chart shown above is an example of a possible price action towards the $20,000 level. Side way price action is good for the market by steady growth. Looking back to the Bitfinex chart, a line is drawn using the upper shadows of the tallest candles of each mountain which will become the possible price targets if bitcoin keeps moving up.
Bear Market Possibility
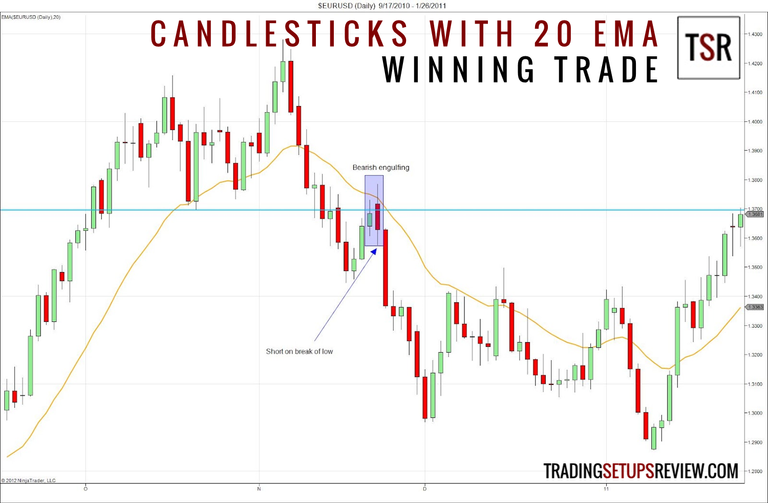
Look out for the price action and indicators for today and tomorrow just in case it does go bear. Comparing the price target line to the one that can be drawn in the chart shown above, a correction still occurred here. The bear movement started at the peak with a very large bearish engulfing with the red candle being more than twice as big as the green candle. The two candle pattern can be visualized by the one already labeled on the chart.

A red inverted hammer represents a shooting star and is another common bearish indicator. The upper shadow is a lot longer than the body. In some instances, there may be a lower shadow. The chart indicated it is better to be bearish because again, slight pullbacks and constant growth is needed.
With all the updates and an increase in adoption, I would expect a side ways price action with still very high volatility for the upcoming weeks. Are you feeling bear or bull? Comment and discuss down below.
Copyrights and Disclaimer.
All images found from Google Images.
Congratulations @infernog! You have received a personal award!
Click on the badge to view your own Board of Honor on SteemitBoard.
Congratulations @infernog! You received a personal award!
Click here to view your Board of Honor
Congratulations @infernog! You received a personal award!
You can view your badges on your Steem Board and compare to others on the Steem Ranking
Vote for @Steemitboard as a witness to get one more award and increased upvotes!