
Hello guys, so this post is going to be a tutorial on how to identify regular and hidden divergences on the RSI indicator and then we will take a look at what this says about Bitcoin's outlook for the future! Let's get straight into it.
Regular Divergence
This type of divergence is to be used when you want to figure out if a trend might possibly be reversing, from an up trend to a down trend or vice versa. There are two types of this divergence and they are simply Regular Bullish Divergence and Regular Bearish Divergence.
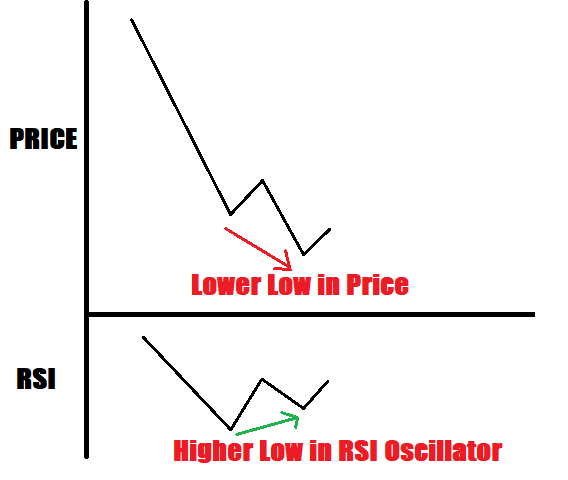
Regular Bullish Divergence is identified when the price of an asset creates a lower low, but on the oscillator (of the RSI in this case) you can see that a higher low has formed. This "divergence" from the normal (normal is oscillator following the price) tells us that something isn't quite right and in this case the down-trend might have come to an end and we are now beginning an up-trend. Therefore, this type of divergence usually happens at the end of a down-trend.
Regular Bearish Divergence is identified when the price creates a higher high, but on the oscillator you can instead see that a lower high has formed. In this case the up-trend might have come to an end and we are now beginning a down-trend. So the Bearish sub-type of Regular Divergence usually happens at the end of an up-trend.

For both of these types of Regular Divergence it tells us simply that momentum is beginning to change from being in favor of one direction to now being in favor of the opposite direction.
Hidden Divergence
One the other hand, we have a type of divergence called Hidden Divergence, which is to be used when you want to figure out if a trend is going to continue, rather than end. Again, there are two types of this divergence and they include Hidden Bullish Divergence and Hidden Bearish Divergence.
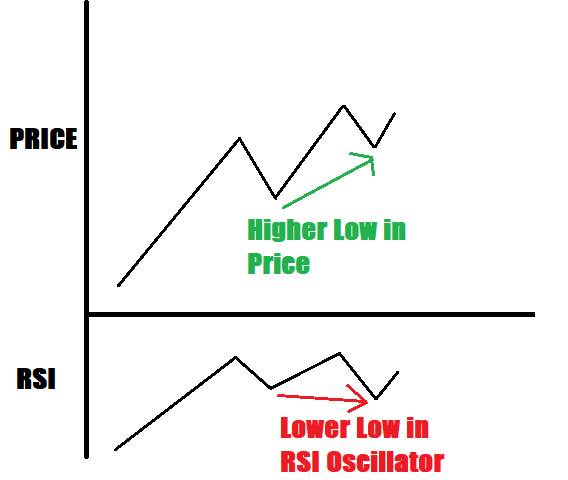
Hidden Bullish Divergence occurs when the price of a financial instrument creates a higher low, but the oscillator forms a lower low. Again, as I said earlier, it is the fact that the price and the oscillator are moving in two different directions instead of the same direction that alerts us to something not being quite right. So being that Hidden Divergence is for identifying continuations in trends, this type of divergence can give you more confirmation that an up-trend will continue going up overall.
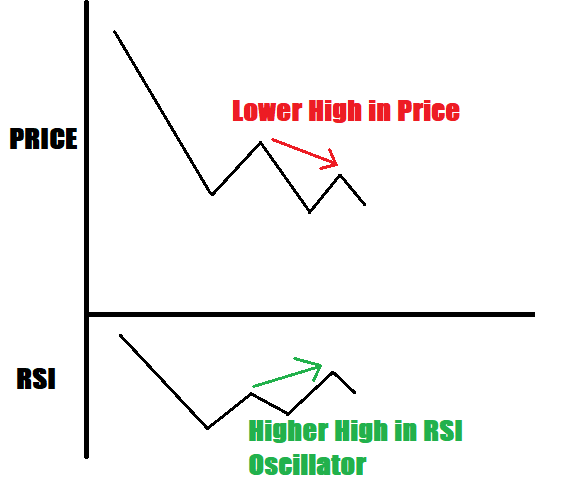
Hidden Bearish Divergence occurs when price creates a lower high, but the oscillator forms a higher high. This type of divergence gives you more confirmation that a down-trend will continue going down overall.
In Summary:
Regular Divergences are for picking tops and bottoms. Bullish Regular Divergence is for picking a bottom, and Bearish Regular Divergence is for picking a top.
Hidden Divergences are for figuring out if a trend will continue in the same direction overall. Bullish Hidden Divergence is for figuring out if an up-trend will continue, and Bearish Hidden Divergence for gaining more confirmation that a down-trend will continue down overall.
That is the end of the tutorial part of this post, I will now show the Bitcoin Analysis I have carried out using Price vs RSI Divergence Analysis:
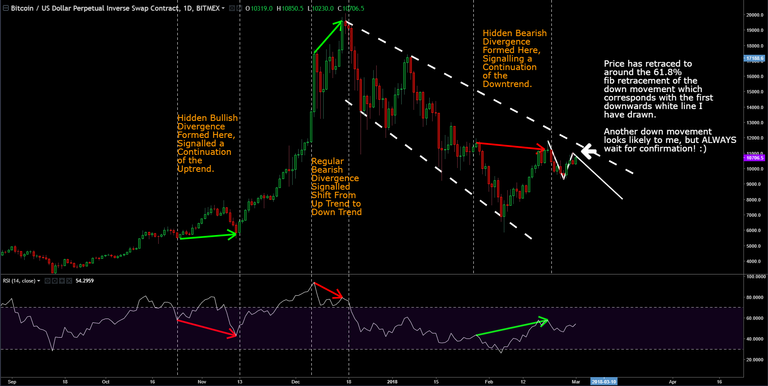
So, from this type of analysis we can see that the outlook is Bearish for Bitcoin.
We can actually take this analysis a step further by adding in Elliot Waves and here is the result (from my perspective):
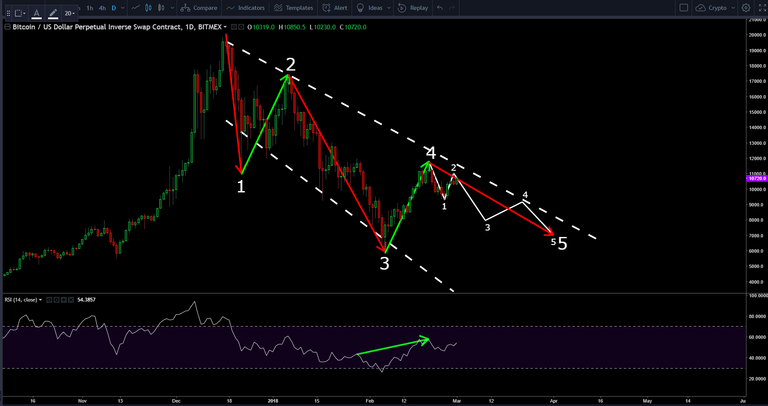
Looks to me like the third wave of the larger five wave will occur now. This to me means that the $5,900 area low that we hit a couple of weeks ago probably wasn't the turning point from the down-trend to an up-trend for Bitcoin and so the true bottom could still be yet to occur. Now I am not saying that we must go below $5,900, we could hit that same area and that could be the true turning point for Bitcoin, or price might not even go that far down.
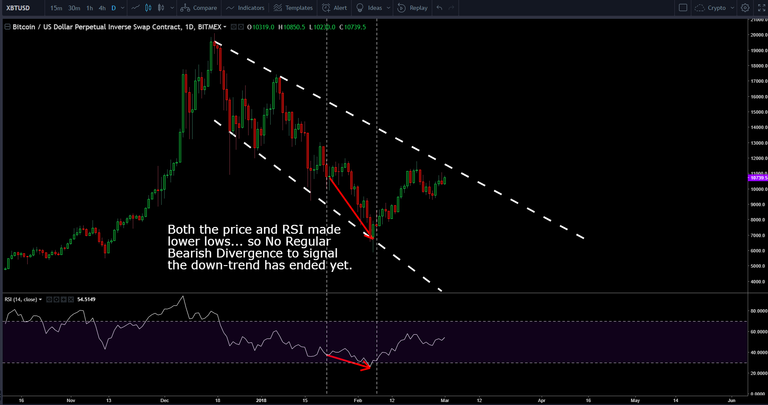
Overall, I'm starting to believe that the point everyone has thought and are still thinking was the true bottom wasn't, and so we are not truly in an up-trend yet, in my opinion. This is actually backed up by the fact that we seen no Regular Bullish Divergence at the so-called end of the Bitcoin down-trend at $5,900, as shown here:
Let me know what you guys think and have a great day, hope you got something from this post and if you drop a follow I will love you forever! (lol)

Legal Disclaimer: This is just my analysis and not to be taken as professional financial advice. Do your own research beyond what you read in my blog posts and make your own decisions based on your beliefs about what to invest your money in.