After a brief consolidation around the $240-250 levels, Bitcoin cash price moved higher against the US Dollar. The price surged higher sharply and broke the $375 resistance. It even moved above the $400 handle and traded as high as $439.28. However, buyers lost momentum, and all gains were quickly reversed. The price moved down and broke the $375 support area to trim all gains.
During the downside move, there was a break below a bullish trend line with support at $330 on the hourly chart of BCH/USD. There was also a break below the 50% Fib retracement level of the last wave from the $241 low to $439 high. Having said that, the 100 hourly simple moving average is currently protecting losses near $300. Moreover, the 61.8% Fib retracement level of the last wave from the $241 low to $439 high is also preventing declines.
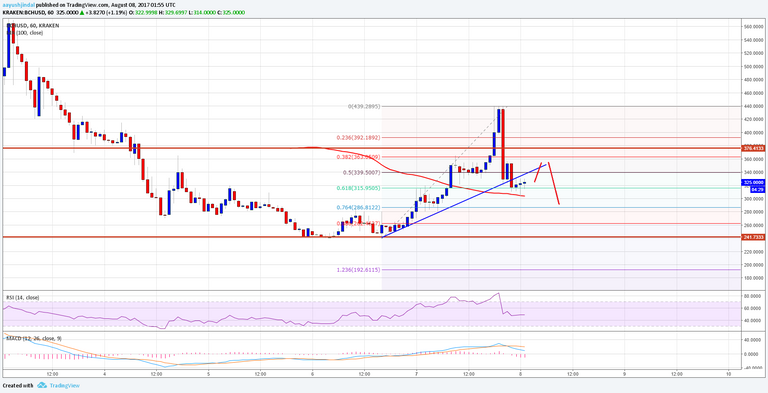
BCH is once again moving higher and trading above $300. It seems like the price may attempt a retest of $375 in the near term. However, upsides seem to be limited by $375 and $400 considering the recent false upside break.
Looking at the technical indicators:
Hourly MACD – The MACD for BCH/USD is now moving back from the bullish to bearish zone.
Hourly RSI (Relative Strength Index) – The RSI is now back below the 50 level.
Major Support Level – $300
Major Resistance Level – $375
source: newsbtc
Hi! I am a robot. I just upvoted you! I found similar content that readers might be interested in:
http://www.newsbtc.com/2017/08/08/bitcoin-cash-price-technical-analysis-bchusd-false-break/
https://steemit.com/bitcoincash/@hotsauceislethal/bitcoincash-price-forecast-8-7-2017
BitcoinCash is Bitcoin's bastard son :-D