
As an effort to inform our community and anyone interested in cryptocurrency trading, we are starting off new series of articles on trading. We asked our CEO Yale ReiSoleil to share insights into what are the fundamental basics that everyone should know.
The interpretation of data would vary depending on the type of scale used for technical analysis. The two most common scales are logarithmic (log) and linear.
Let’s take a look at these charts:
BTC (linear)
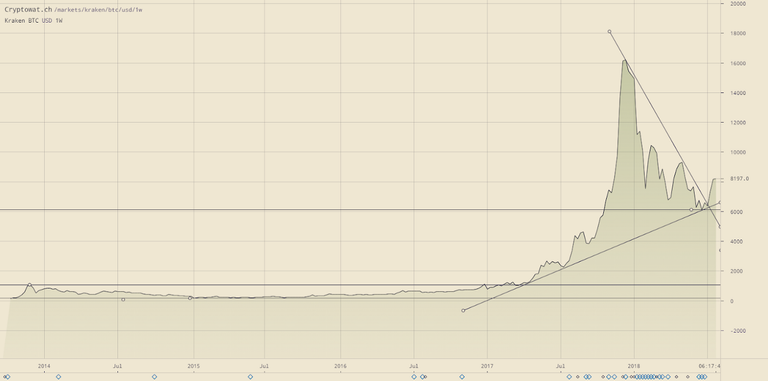
BTC from 2013 to date
This is what you see every day on the internet, even on most exchange trading charts.
The drop in the past 7 months certainly looks huge, and everyday you’ve heard about the BTC “bubble” because of that.
While the chart is not wrong by itself, it is misleading.
Now look at the same BTC price chart in a different, correct, perspective:
BTC (logarithmic)
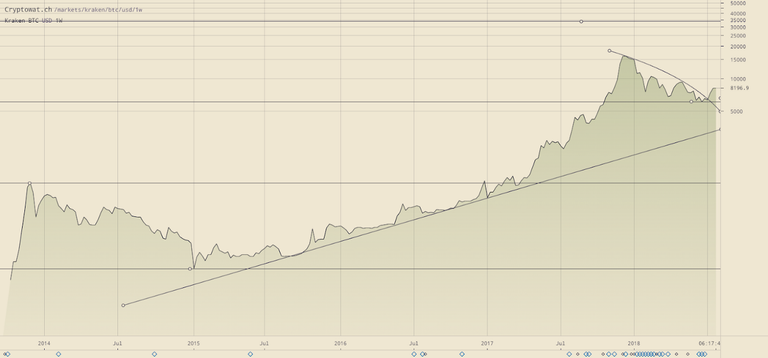
This is exactly the same chart. The recent drop looks very normal, given the higher growth started at the beginning of 2017.
Interestingly, now you can see that BTC price could reach $35,000 by 2021, based on this ‘long-term’ chart pattern.
The key to understand BTC, or any other securities’, price movement is the logarithmic chart. A logarithmic scale is a nonlinear scale used when there is a large range of quantities. Common uses include earthquake strength, sound loudness, light intensity, and pH of solutions. But it is particularly useful in trading.
It is based on orders of magnitude, rather than a standard linear scale, so the value represented by each equidistant mark on the scale is the value at the previous mark multiplied by a constant.
Why you should use log scale for trading
A logarithmic unit is an abstract mathematical unit that can be used to express any quantity that is defined on a logarithmic scale, that is, as being proportional to the value of a logarithm function.
When BTC is trading around $8,000, a drop of $200 is different from when it was $1,000. It is a much smaller proportional drop. While the pundits on TV will scream a ‘$200 drop!’ all day long, it was a very small percentage pullback in trading reality.
Therefore, as we can see, a good trader builds his trading system based on a proportional scale, a percentage (%), rather than the actual dollar amount.
*Disclaimer: This is not a recommendation to invest, nor can this be considered an investment advisory service. No money changes hands that will benefit IOB as a result of this post. Full disclosure: We long BTC and ETH at the time of the publication.