A few charts with relevant indicators for your pleasure. ;)
Chart parameters:
3 day volume candles
Timeline from Low of $162 in late 2015 to the recent high of $2922
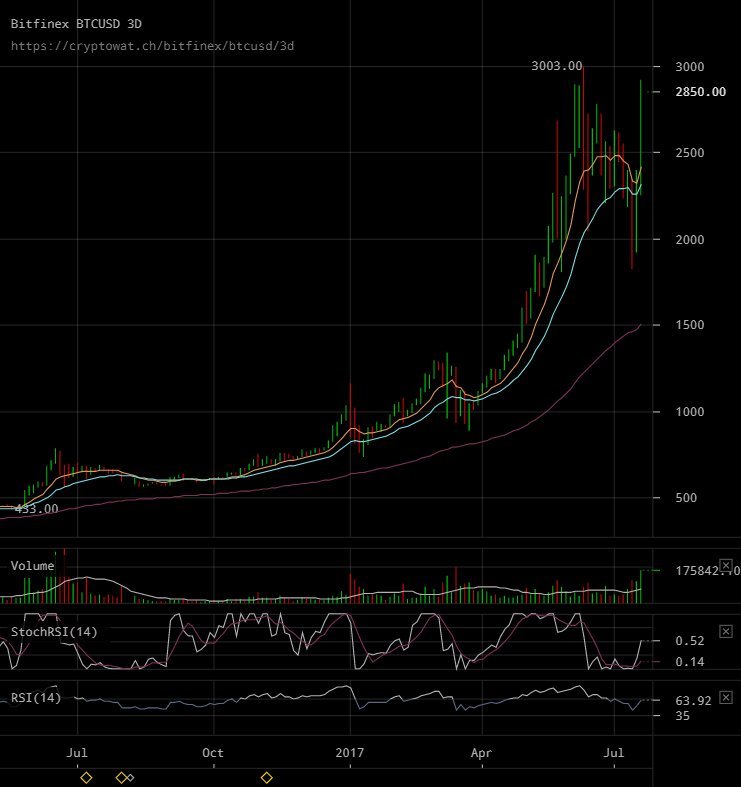
Chart 1: Fib levels, + Relative Strength Index
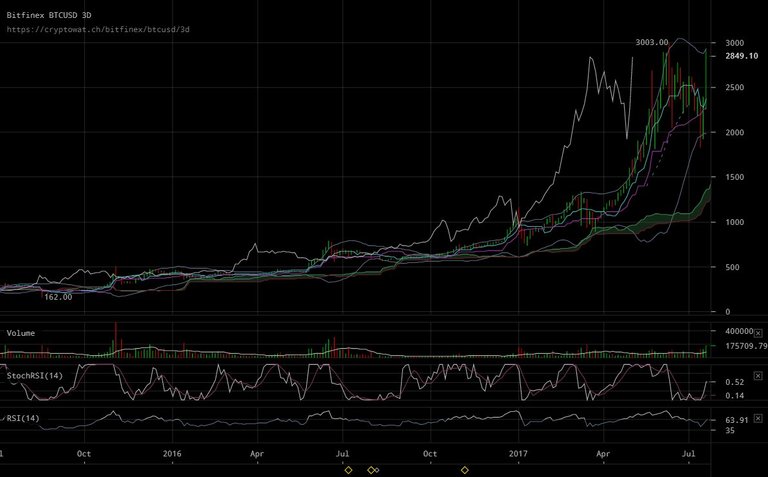
Chart 2: Exponential Moving Average (EMA) Simple Moving Average (SMA)
Chart 3: Chikou Span (Ichimoku Clouds)
Chart 1

Moving between the top FIB level's struggling to breakthrough could be a move to test the 62%($1900) level again.
RSI of 64 signals medium overbought with very little room above, a signal downwards.
StochRSI of 0.5 is midway no indicator
Chart 2
EMA turning upward signals a buy.
SMA looks to be continuing up also soft signal upwards.
Chart 3
Chikou span turning upwards is a positive indicator for upwards momentum
Conclusion
3 positives and 2 negatives hard to tell which direction prices is going.
I think due to the lack of liquidity in the market breakout is still at least a week away and a return to $1900 is on the table.
For a breakout to be definite must close above $2960.
For a definite downward trend close below $2500.
I also think volume should be close to $3MIL to have enough momentum to break the top.
Please let me know your opinion and any comments would be appreciated.
Upvoted and resteem
thanks vhinz88 :)
Disclaimer: I am just a bot trying to be helpful.
Upvoted via steemchat from Emma to My Best Friend