Bitcoin has recorded another new high today. It has hit high of $2990 and now its is trading at $2964. Well new highs are not new for this script. It keep on hitting high after high pretty rapidly for past few months. Bitcoin is surely is in bull run, and to see this or say this you don't have to be technical analyst.
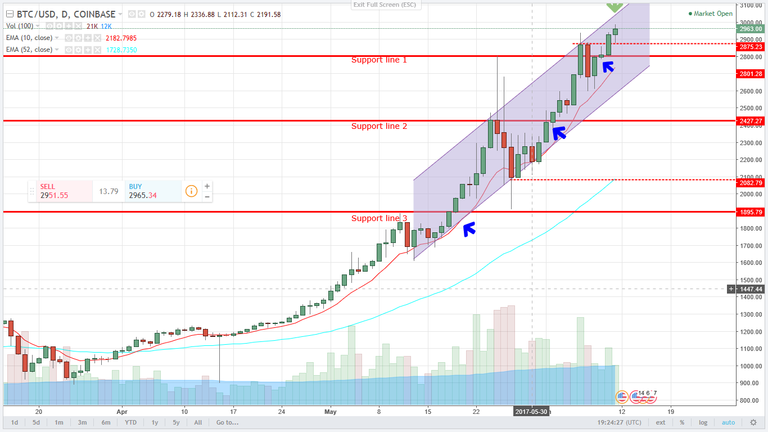
But as an technical analyst there are few things to notice in this clear bull run for which I want to draw your attention on chart below. Following chart is on daily scale, red lines are support line and are marked in numeric order. As you can notice after every breakout which I marked with a blue arrow, Bitcoin just surge toward next high without really consolidating. This move is can be termed as 'Pump and Jump'. Bitcoin moves are also sometime looks like formation of bubble but every time it negates this and emerge as valid.
Another thing you have noticed in chart that Bitcoin is following a 'RISING CHANNEL' which is highlighted diagonal blue zone. In this zone Bitcoin hit lower trendline of this channel first then next top trendline . According to this wavy pattern, next move of Bitcoin is going to be touching of upper trendine and I marked that touch point in lower direction green arrow which is roughly around $3050.
So, i conclude my analysis here by saying that after this occurrence , I expect correction in Bitcoin prices and it may touch lower trend line of this RISING CHANNEL, which may be sharp correction or in parts testing dotted support, then 10 day EMA (red wavy line) and finally lower trend line mention before .
If you like my analysis do upvote, follow, comment @jimmyrai28
if not then criticize, this also will be highly appreciated.
You can also drop a comment in 'reply' if want you want me analyze any script of your choice.
Excellent analysis Jimmy, as alway. I enjoy how easily you explain the tech analysis in plain English.
Quick question...Does the MACD (Moving Average Convergence Divergence) and RSI (Relative Strength Index) apply in Cryptocurrencies to pick good entry points?
One final question, where do you get your chart program for the tech analysis?
Thanks in advance, and steem on.
Thanks alot for your appreciation.!!
MACD and RSI are good supportive indicator but they can't be rely upon fully to enter or exit be it crypto or any other xyz script but they prove very helpful if applied and seen as a whole with movements of other parameter in chart.
My source for charting program are www.investing.com and www.tradingview.com.
Thank you for your kind reply. Love the tech analysis - I'm learning much.
I'm not a crypto expert but my son is and I'm going to pass along your analysis to him -it seems to confirm what he was just telling me the other day, so I'd say your conclusions are accurate
Thanks sir for stopping by and pass my hi and best wishes to your son!!!
I agree that we are probably due for some a correction in bitcoin and maybe some altcoins also.
yep sir, u r on mark!!!