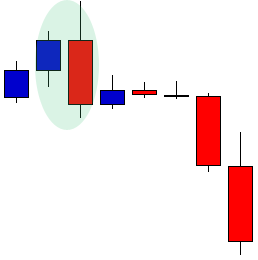
Bearish Engulfing Candlestick
The opposite of a bullish engulfing candle, a bearish engulfing candle pattern will move to test a level above the previous day high, then after finding selling volume will move sharply downwards, breaking the previous day’s low. Again this can be a precursor to a sharp sustained drop in price or trend change.
The bearish engulfing pattern can happen at tops or within a trend, signaling further moves downward. In the chart below of Goldman Sachs (GS), the start of the downtrend in March, 2012 was topped by a perfect bearish engulfing pattern. Price attempted a new high and was sharply rejected to the downside, sparking a fresh three month downtrend.