![]()
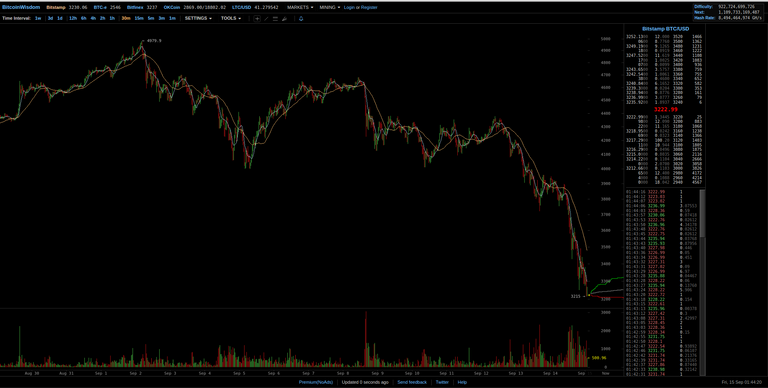
Btc is Flash Crashing At The Moment.
Things are moving Fast and Wild with Crypto Currencies.
Chart of Bitcoin including august and september 2017
Highs: ~ 5000 $
Lows: nearly 3000$ ATM
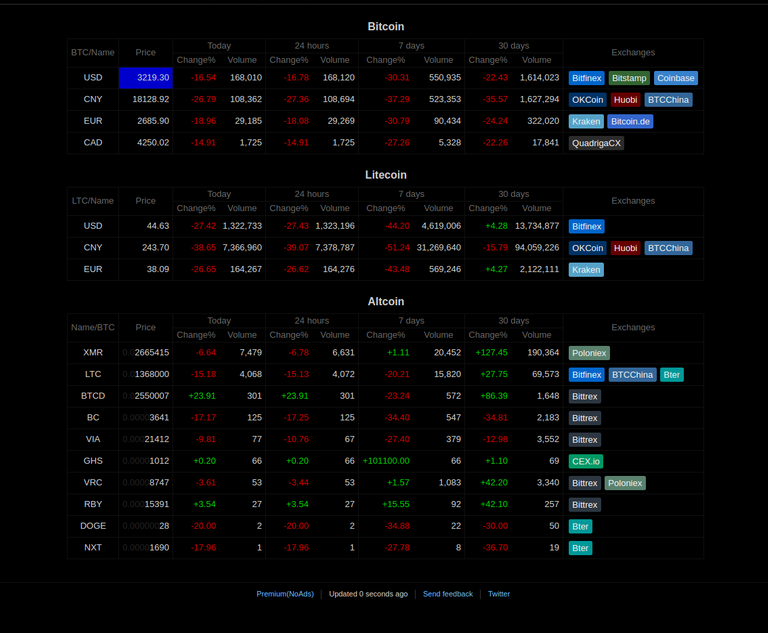
Looking on the Top 10 Crypto Currencies, we can recognize obvious similar movements.
(@https://coinmarketcap.com/)
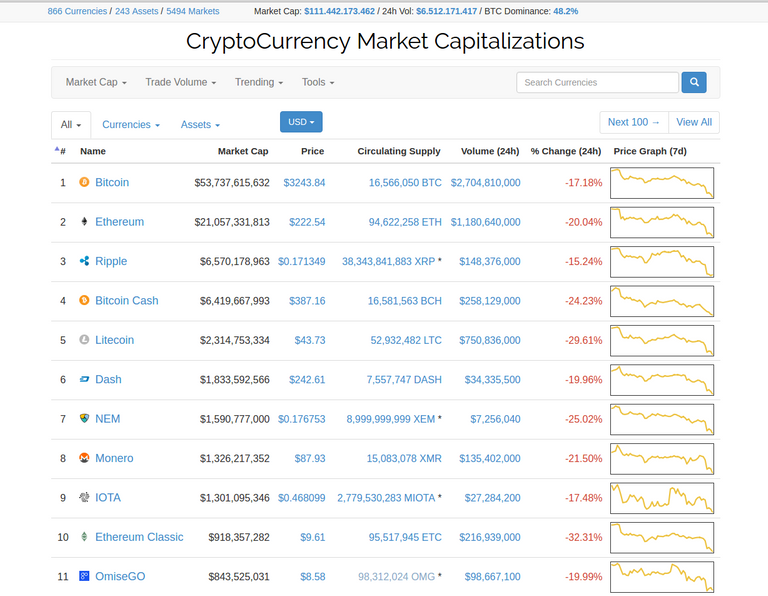
Red Double Digits for nearly every Altcoin and token in the top 100 !
This is very likely to happen if btc is crashing, as nearly every crypto currency is still hardly directed to the btc ecosystem.
The Price Chart for all crypto currencies collectively looks like this !
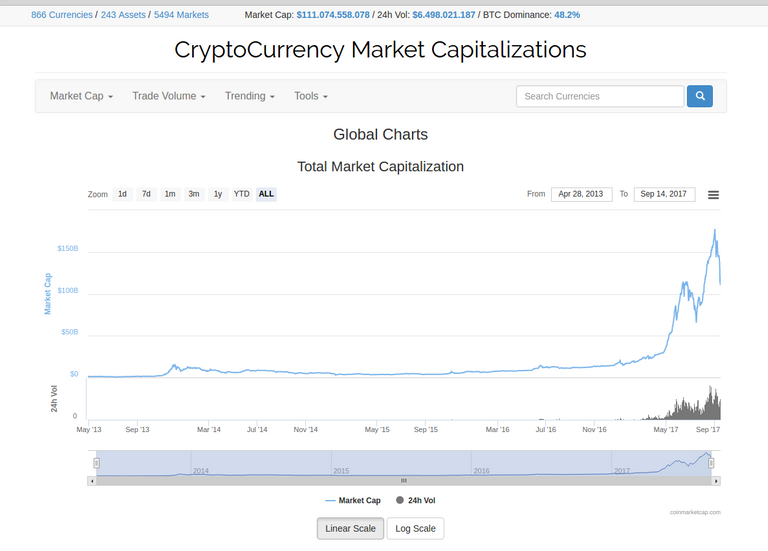
You aleady can see a very big dumb within the long term charts.
From $ ~180 billion market cap down to $ 110 billion in 2 weeks.
This should n't necessarily indicate any trend...
but the dimensions of this "Dip" are already remarkable !
The correlation to Bitcoin is clearly as the Charts look almost identical
Let's change Perspective
If we look at the same charts but with a logarithmic scale things won't look that massive scary anymore.
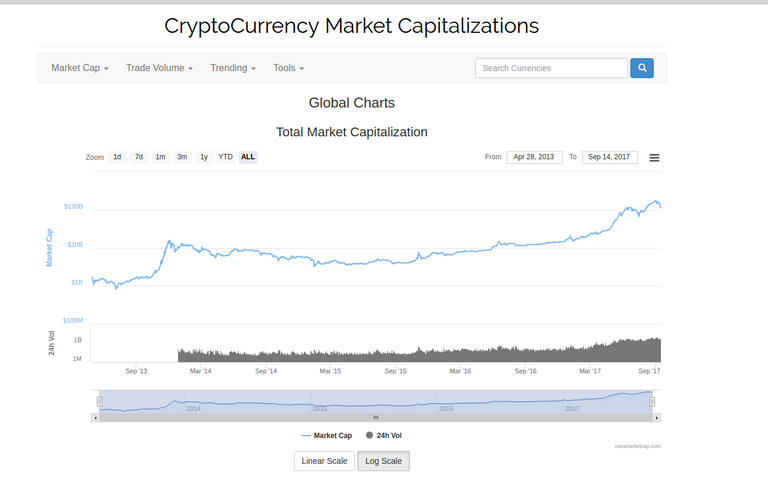
These scales reveal a different perspective on the history of charts and show a more accurate view on past price ratios
(if you want to know how a logarithmic scale is different look here:
https://en.wikipedia.org/wiki/Logarithmic_scale)
Let's zoom out even more and have look at a bit longer timeframe...
Bitcoinwisdom.com
... is a website which presents a lot of fairly wide data about prices of most popular crypto currencies. especially Bitcoin.
Several different price movements can be displayed based on time, location and currency, using many different graphical indicators and tools.
This is how the website looks like.
The first page gives an overview about most common crypto currencies prices and price movements for :
- Today
- 24h
- 7 Days
- 30 Days
Also most Price Changes strongly going down !
To watch a chart, you have to choose a crypto currency first.
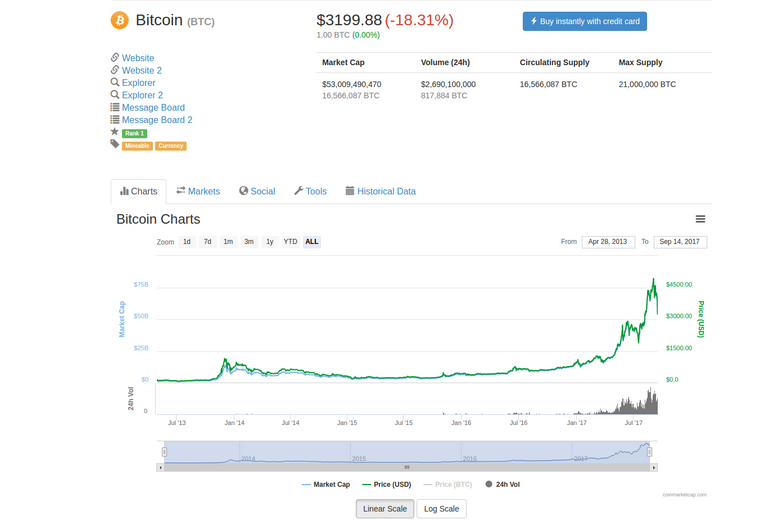
we concentrate on "Bitcoin".
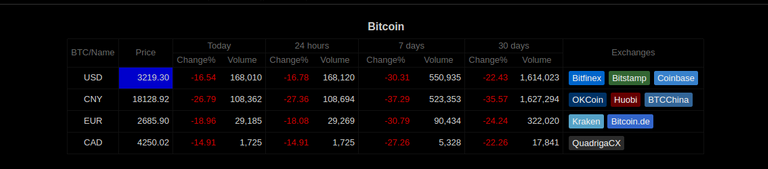
And we choose the Pair "BTC/USD" at the top.
Now we have to decide for an exchange available for this pair.
We will have a look into the "Bitstamp" charts !
(as they present a very steady and adequate old chart in the most currency)
So we click on that green "Bitstamp" Button to watch this Chart
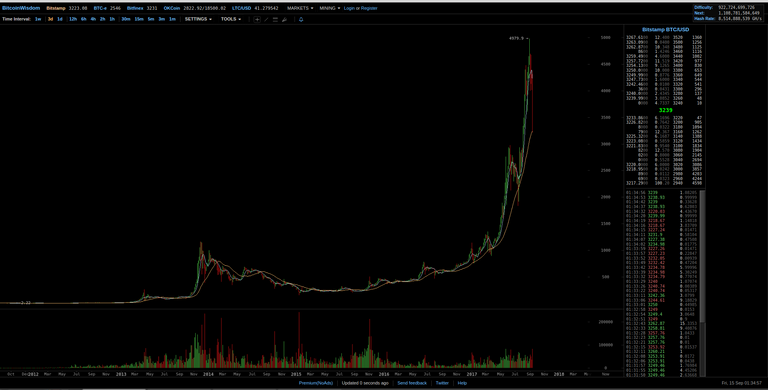
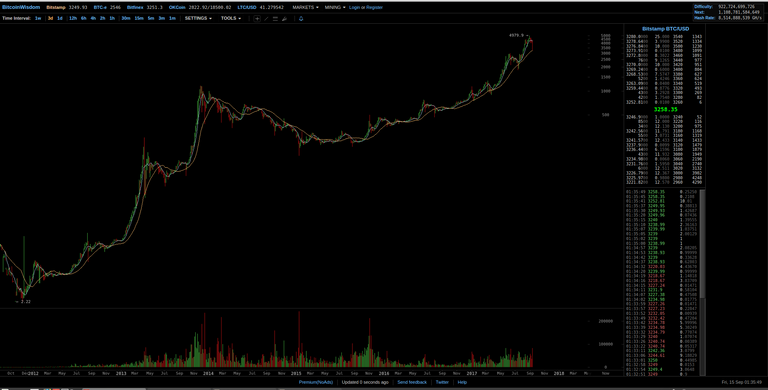
This is the whole available timeframe from the beginning of 2012 until today !
(by 3 days time interval in a linear scale)
This Chart looks Crazy, if you would consider Bitcoin as an Investment !
It doesn't need an explanation about bitcoins past price trends.
But for the future ?!...
Keep in mind that extraordinary big Red Candle at the end of the Chart, which is NOW !
Similar things happend in the past
May 2013
from 250 to 50 in a few days
Dec 2014
from 1200 to 400
In these examples the Flash Crash triggered or indicated a long BearTrend !
So this isn't very unlikely for cryptocurrencies to happen, but it also don't have any clear meaning for the future !
Again the Logarithmic Scale
In this chart it is easier to identify some typical pattern or trends.
Even if The Value of most cryptocurrencies is going down at the moment and maybe for a long time from now, these movements would be very natural based on past pattern.
In longer terms these charts look reliable and promising !
- July 2015: High 309, Low 209 (33% dip)
- June 2016: High 789, Low 465 (41% dip)
- January 2017: High 1166, Low 735 (37% dip)
- March 2017: High 1294, Low 888 (31% dip)
- May 2017: High 2690, Low 1810 (33% dip)
- June 2017: High 3003, Low 1826 (39% dip)
- August 2017: High 4492, Low 3599 (20% dip)
- September 2017: High 4970, Low 3250 (35% dip)
r/bitcoin overview: ...

So what will happen... ?!
These Price Changes with such big Volume could signify 2 things.
- An upcoming Bear Trend for Bitcoin and therefore crypto currencies in general.
or - Just a Price Dip and fastly continuing Price Pump.
But for sure Bitcoin's Price won't go sideways and this will cause big changes within the cryptocurrency ratios !
So be aware about bitcoins trend !
What do you think... ?!

BTC's next stop, 6800 USD... And then another dip, and then 13,000 by March, 2018.
-Mark my Words...
very optimistic perspective !
this would be a crazy ride ahead.
This is just the beginning there will be many highs and many lows but it has to go high at a consistent rate not all of a sudden because that's what causes a big fall
just upvoted u...can u do the same for me please :)
@joshbreslauer The online market place is a wonderful industry for truth of the matter and lies. Now it is actually quite challenging to acknowledge where by the reality is.