Bitcoin stacked timeline price analysis for August 2017 - March 2018.
October-March trend shows extremely high correlation to August-September trend.
If it holds, a longer and larger bull run is in the near future.
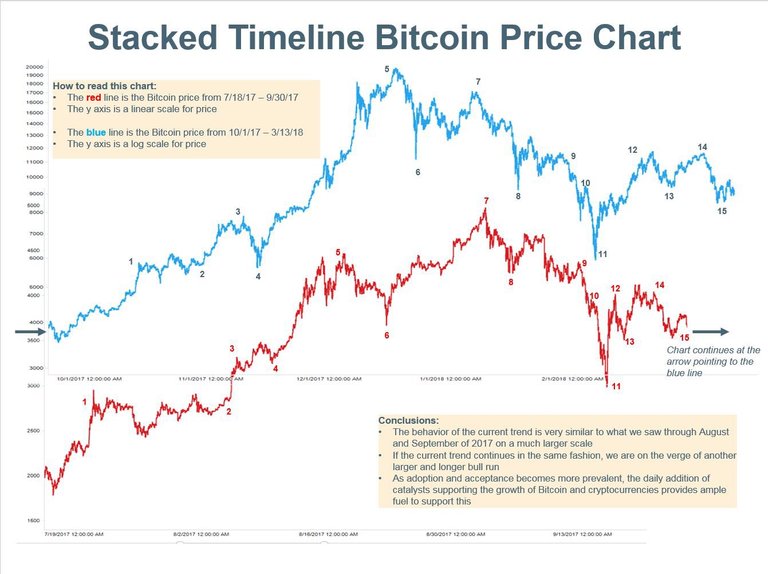
How to read this chart:
->The RED line is the BITCOIN price from 07/18/17-09/30/17.
->The y axis is a linear scale for price.
->The BLUE line is the BITCOIN price from 10/01/17-03/13/18.
->The y axis is a log scale for price.
Conclusions:
->The behavior or the current trend is very similar to what we saw through august and september of 2017 on a much larger scale.
->If the current trend continues in the same fashion, we are on the verge of another larger and longer bull run.
->As adoption and acceptance becomes more prevalent, the daily addition of catalysts supporting the growth of bitcoin and cryptocurrencies provides ample fuel to support this.
If you liked the content !
Upvote, Resteem and Follow @koe7