
Summary - Support and resistance levels
Support and resistance levels are among the very basic concepts of trading, both long-term and short-term trading. Both levels are places on the graph where the price tends to stop and, in some cases, turn. Many people therefore use them as potential points to buy or sell, especially if there are other indicators that the price should be reversed just at this place.
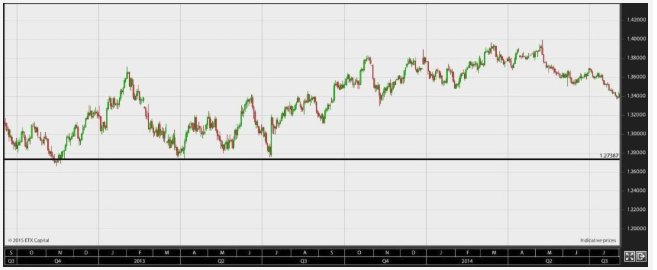
Below is an example of the euro-dollar price in the period from autumn 2012 to autumn 2014, where the price around 1.2738 serves as a support point and therefore becomes a buying opportunity for many traders.
The development in Euro Dollars in the period from autumn 2012 to autumn 2014. The price has found a support point about 1.2738, which is difficult to break through.
Only a few successful traders does only use the support and turn-points to make their purchases and sales, but it serves too many as a contributing factor when making important decisions. It should be noted that the more times a support or resistor has been hit, the stronger it will be. Conversely, the price may break much further down when the resistance is finally broken.
Many beginners in daytrading are tempted to trade price breaks, for example, to go short immediately if a support point is broken. In most markets, this is a fairly risky strategy, as you often experience small fake breakouts, where a support level is broken shortly, but then reverses. You should therefore be careful about using this strategy.
Resistance levels, of course, work in the same way, just with opposite signs. Here are the levels that the price has encountered many times before, without being able to break through. Therefore, if you want to buy up in a market, you should be aware of whether there is a "ceiling" that the price bounces against, as it may make it less likely to complete the transaction successfully.
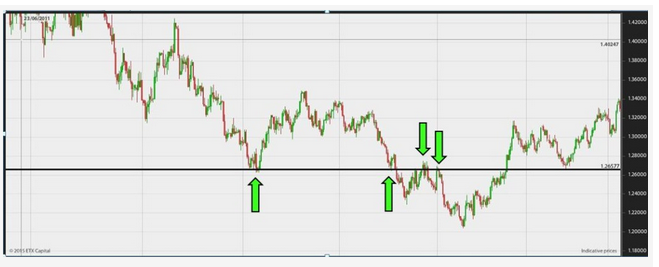
Another known phenomenon that relates to support and resistance is that support can often develop into resistance. An example of this can be seen below.
Here is another example from the euro dollar, where you can see that a former support point can later become a resistance point.
One of the explanations for this phenomenon is that when an established support point is broken, many will basically like to short, but some traders do not. When the price then returns to the previous level, it will be natural for them to shorten the market at that time .
Hi, thank you for contributing to Steemit!
I upvoted and followed you; follow back and we can help each other succeed :)
P.S.: My Recent Post
thank you