As a follow on to my post on how to trade the double bottom, I've been waiting for another chart pattern on crypto charts, and the movement on Bitcoin over the past couple of days has given us an inverse head and shoulders pattern to study.
The Inverse Head And Shoulders
The head and shoulders and the inverse head and shoulders are common patterns. They're seen regularly, and they tend to be a good indication of a reversal in price direction. In the case of the inverse head and shoulders, this means that prices are about to arrest their decline and become bullish. The characteristics of the head and shoulders and inverse head and shoulders are very similar, except that, as well as relying on price movement, we also rely more heavily on volume when looking to trade the inverse pattern.
The head and shoulders is shaped loosely like a head and shoulders, and the inverse is basically an upside down equivalent to this.
A Bitcoin Example
Using the 1hr Bitcoin price chart, you can see the pattern, below, in subtle green.
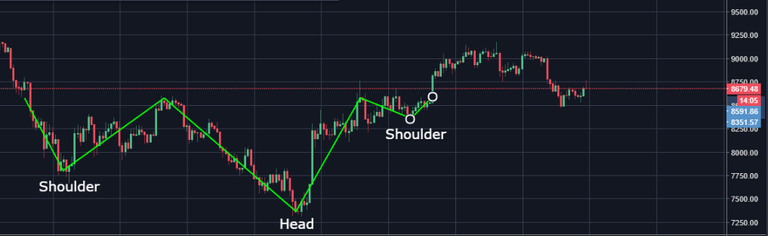
The Pattern
Normally we would be looking for the shoulders to be closer in price, but the pattern is just about good enough here. Prices have dipped to a low, before bouncing back up and forming a reaction high. They then dip further to form a lower low, bounce back to a similar reaction high, and then bounce back down to a price around the same as the first dip.
The perfect inverse head and shoulders setup would have similarly sized shoulders, both in terms of the height and width, but some disparity is allowed.
Head And Shoulders And Volume
As I mentioned above, it is preferable to see volume during the upward momentum of a standard head and shoulders but it should be considered essential in an inverse head and shoulders, typically around the head and at the right shoulder, where prices break the neckline.
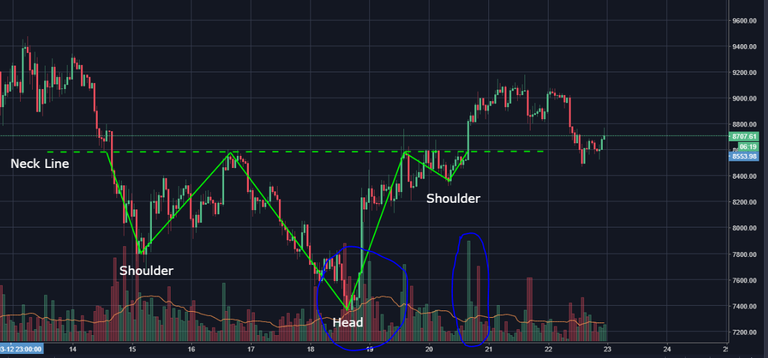
In this image, you can see that the volume increased at the head and the neckline break of the right shoulder.
Neckline As Support
As you can see from this pattern, it is not uncommon for prices to come back and test the neckline, which has now become a support line, but this doesn't necessarily have to occur. Also, in our example, prices do come back to test the neckline, and even pierce the support line, but they don't close below and they immediately head back above the line. Some traders may exit the trade at this point, others will remain in.
Buying In
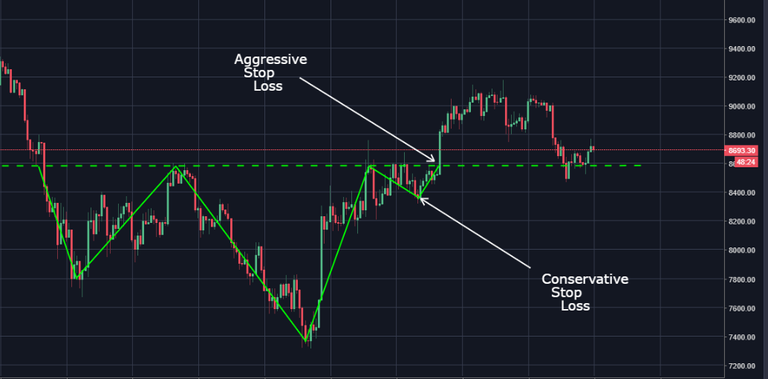
The aggressive trader will typically buy in as soon as the price breaks above the neck line on the right shoulder. There is a risk with this method, namely that the movement was a fake out and not a proper break out.
A conservative trader would wait for prices to close above the neckline. This can eat into profits, but it means that there is less chance of the move being a fake out.
Target Prices
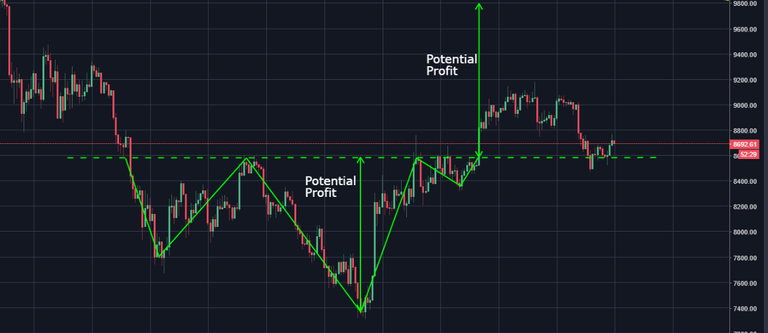
To calculate the potential profit, determine the difference between the head point and the neckline and add this to the neckline price, as shown in the image below. You can take a more conservative approach to profits, if you wish, utilising your own risk to reward ratio.
Traders tend to look for a confluence of indicators and analyses, so look for additional trend lines and other factors that occur at or near the potential profit line and consider combining these to give you a more reliable price target.
Setting Stop Losses
Stop losses should be placed in order to minimise any potential loss, because no pattern is infallible. In this example, there is still a chance that prices could head back down below the neckline, now support line. Investing in cryptocurrency is about playing the numbers and ensuring that your risk to reward ratio keeps you in profit. A conservative stop loss would be placed at the trough of the right shoulder. An aggressive stop loss would be placed at the bottom of the breakout candle, as per the image below.
Watch It Unfold
And there you have it, the inverse head and shoulders pattern. You can continue to watch this one play out, and see whether the bullish uptrend continues, or if the head and shoulders eventually fails without reaching the price target. I will try to update in the comments, as the trend emerges.
Remember that while symmetry is preferred in the pattern, if you wait for an immaculate pattern, you will never invest in anything because the charts are so rarely perfect.
I hope this has been of some use, and I will publish any inverse head and shoulders patterns as I spot them, so that we can all continue to learn.