
Let us first analyze what is happening, before examining what this means.
Essentially, the Bitcoin chart has 3 main support lines (trend):
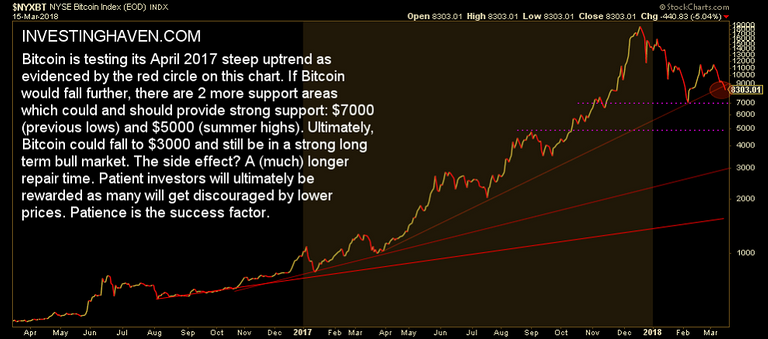
1- The trend line (red) represents the bullish trend that began in August 2016.
2- The trend line in the middle (yellow) represents the bullish trend that began in early 2017.
3- The tallest (green) represents the strong bullish trend that began last April, when all crypto-coins "exploded.
In addition, to make things more complicated, there are the support lines that are even more important:
1- The $ 7,000 (white) line is the February low of this year. It is important that a correction dive up from a previous low.
2- The $ 5000 (blue) line is up in August. It is much more important that a correction remain above a previous high.
What does all this mean?
This means that Bitcoin needs to continue trading above $ 7000 to stay strong, which is likely to mean that the next bullish cycle will begin in April.
If the bitcoin drops below $ 7000, it's really crucial that the $ 5000 level is respected. Otherwise, it does NOT imply that the bull market is over, but this would mean that the repair time will be longer and possibly the next cycle until the beginning of this year.
If $ 5,000 does not hold, lower support levels are $ 3000 and $ 1500. Even if Bitcoin fell at these price levels, it would still remain in a bull market in the long run. However, the repair time will be very long, undoubtedly from 12 to 18 months, in which case we would be in a scenario similar to 2014 when Bitcoin crash and it took more than a year to stabilize and began to climb again a year and a half later.
we are waiting to trigger purchase alerts, but we need to see first when and how Bitcoin will "go down".