I Seem to Have Found for myself what I am using to judge these falls since they seem to be following a logical breakdown using various long term averages (log based EMAs / VWMAs), pitchforks, fib extensions and fibs, linear regressions, non-linear regressions estimates, RSI including divergence and the TD sequential. It sounds like a mess, but put together in a reasonable, logical way I find it very useful.
My Process:
Figure out your relevant moving averages. I use...
- Log EMAs: 38, 62, 100, 138, 162, 200, 238
- VWMAs: 20, 50, 200
- Do a linear regression of the all time high to the most recent candle and keep moving day by day and week by week until it breaks out of it on a 3 standard deviation move
- Fib / fib extend from the top of a move to the bottom of a move, and in the case of an extension to the next peak or trough, then pick the relevant fib numbers to show. These are the major landing zones
- Pitchfork the top of the move to the bottom of a move with an appropriate long term tail, I try to pick a 9 or 13 on the TD sequential. These mark the "time" of the move—ish. It attempts to give a time based element to our analysis on a ballpark level and creates some "steps"
https://www.tradingview.com/x/FvvxC6G8/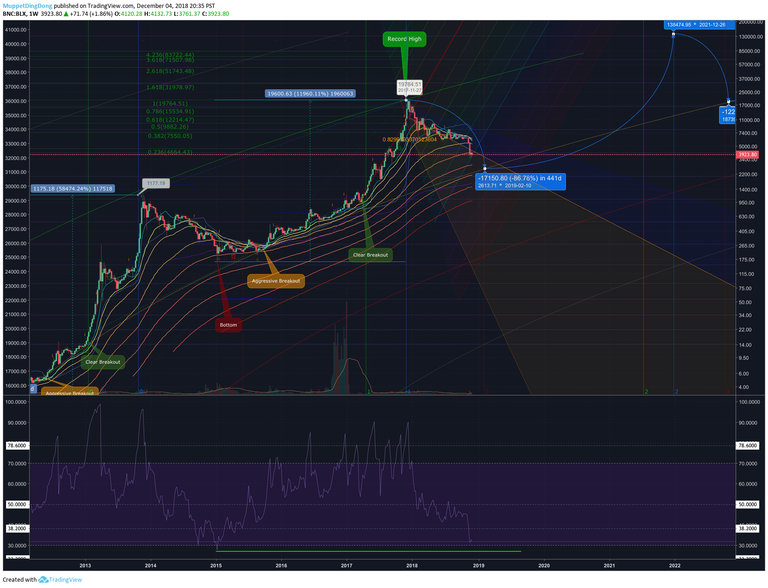
- If we maintain trend we will bounce right around the 2600 level, it's possible it may wick down further but ballpark-ish that's my call for an actual rebound point based on Metcalfe's Law (probably on a weekly closing basis give or take a few although it's never spent more than a wick of time bellow that "baseline"), see previous article on why that may be a logical place to expect support: https://steemit.com/bitcoin/@muppetdingdong/when-blast-off-when-moon-metcalfe-s-law-and-bitcoin-and-the-94-of-bitcoin-s-price-explained-by-math-oh-shit
- If we don't that's when things will be interesting, and will signal a new phase for bitcoin
- The green target line is coming up on the RSI at the bottom that should signal "capitulation" at 27 last time around, people front running so it never got to the fib line at 23.6
- The bottom bottom is likely to be on or around a 13 on the TD sequential which we are at an 8 in the countdown, on a weekly 4. We will be sliding for another 5ish weeks good chance
- You can see the blue linear regression area combining with the pitchfork lines to create various long term triangles in time (saves me having to draw all of them lol). Those triangles are going to be relevant along the way as support and resistance
https://www.tradingview.com/x/DUkRVNeO/.png)
And if you're asking yourself where could it go below there, particularly on a very short term basis as price crashes through stops, people close shorts, etc... look at all those moving average lines for broad guesses.
https://www.tradingview.com/x/DHLJYUO2/
.png)
And if you want more pretty lines on a chart fibs and the like, this is where I see some congruence
https://www.tradingview.com/x/0BfrYf0q/.png)
- $2550-2900 is now a critical zone
- The drops after that look ugly but possible
- The next major support zone will be that $880-1000 range and that is a must hold, all hands on deck, holy fucking shit the world is exploding, etc...
https://www.tradingview.com/x/MlOJQJHb/.png)
- Weekly 4, on an 8 countdown to a 13
- Scary red fib lines 😨
We MUST break out of this long term linear regression drop before we have any hope of price recovery...that will be MANY months if not at this point I hate to say it...years. Capitulation hasn't happened yet. Probably. One more major drop incoming in a week to a few weeks or so based on this analysis then we will see if that 2500ish level holds and if that long term Metcalfe's Law pattern holds, if that pattern doesn't hold... Uh oh.
Look on the 1hr / 4hr / 1 day RSI for divergence to see when that is happening.
If this analysis is correct, another 5ish more weeks of bitcoin price winter in this bear market. Then a re-evaluation phase, assuming we stay above about 2500 on a weekly closing basis. Negative case on this would be fuck all these fib lines, moving averages and TA, going below 2000 will cause chaos among the community where hodlers of last resort will rethink their positions holding bags? You decide.
Some random dude sharing my opinions, not a technical analyst or licensed to make any financial decisions. Disclosures and yadda yadda, don't listen to me lol. I'm trying to learn this stuff as much as anyone, I'm just a math nerd.
Interesting. Thanks for sharing it
Posted using Partiko iOS
Congratulations @muppetdingdong! You received a personal award!
Click here to view your Board