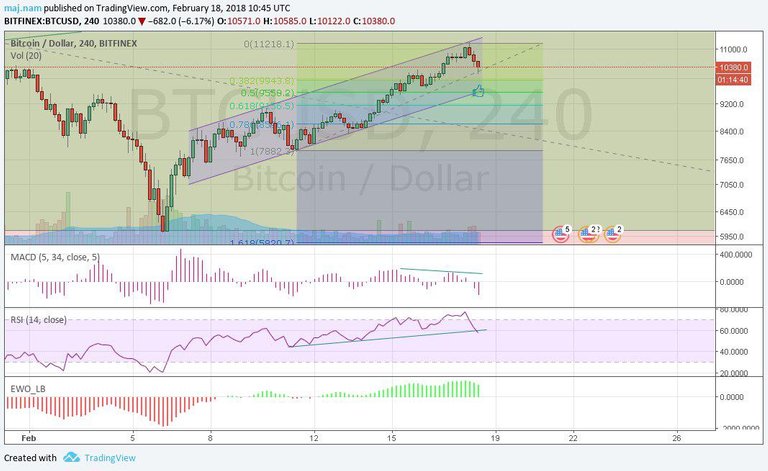
Bitcoin touched the high trend of H4 bullish channel. A negative divergence in RSI is also happen, so we expect touching low level and 50% of Fibonacci retracement or $9600. We expect bitcoin falling at least $10000
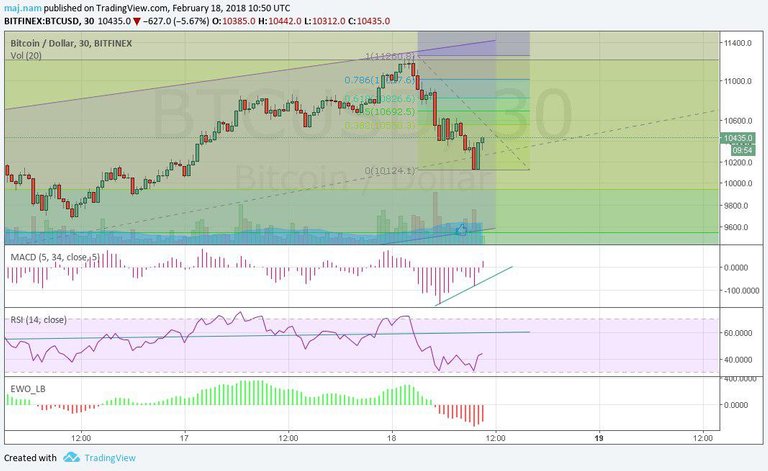
In 30 Minute time, also a positive divergence happen and we expect short time increasing bitcoin until $10800.
So you can wait and sell bitcoin on $10800 until touch $10000.

If you think this to be useful information:
Feel free to use and share my charts, but please mention me, @namnabat as the author. Otherwise it is considered plagiarism and I will flag you and advise my friends to do the same.
MUST READ!
DISCLAIMER: This post / analysis serves general information purposes only. I am not, and never will be a financial adviser. The material in this post does not constitute any trading advice whatsoever. This is just the way I see the charts and what my trading ideas (from my personal experiences) are. I use chart pattern and Elliott Wave analysis for my trading ideas.
For full disclosure: The author of this post is holding positions in this market at the time of this post. Please conduct your own due diligence, if you plan to copy anyone investment decisions!
If you make any trades or investments after reading this post, it is completely in your own responsibility. I am not responsible for any of your losses. By reading this post you acknowledge and accept to never hold me accountable for any of your losses.
Please consider leaving a comment, like or resteem, if this post entertained you or helped you see things differently...

I agree with your analysis, BTC will most likely pullback to the 10k support before any more continuation. Followed you since I do crypto TA updates as well!
Thank very much