Here’s a quick look at the bitcoin intraday price chart for the past 5 days.
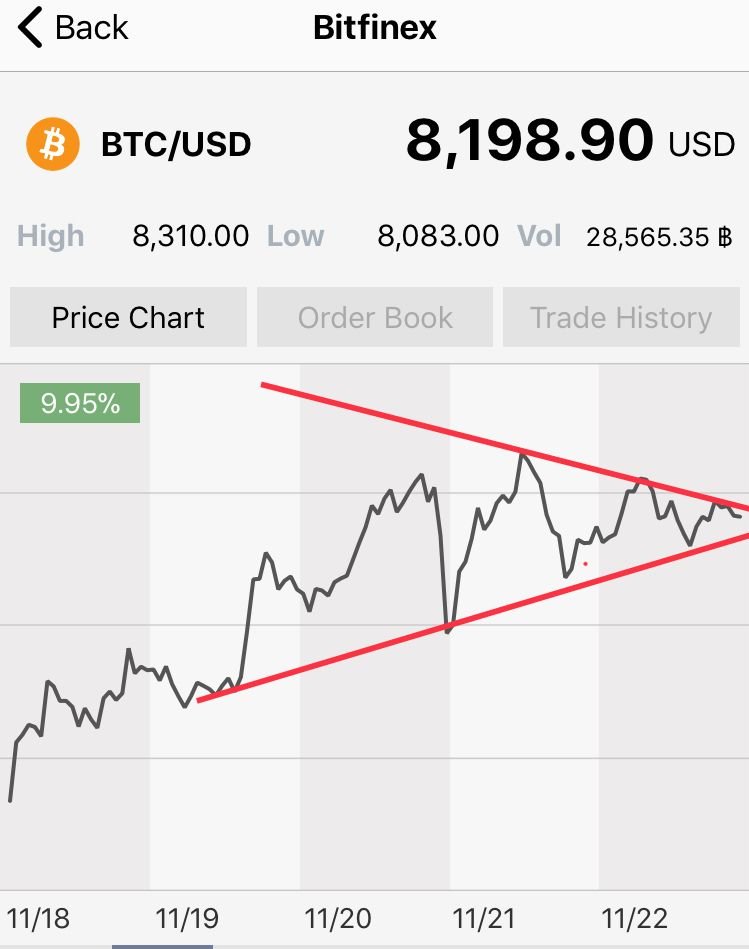
There seems to be a symmetric triangle forming. This pattern sees higher lows together with lower highs which form a triangle with the two trend lines.
Symmetric triangles can break in either direction, so watch for either a break above the top trend line or a break below the bottom trend line.
Thanks for this quick tip