-There was a major drop in bitcoin price after it broke the $12,000 support against the US Dollar.
-The price is currently holding the key $10,800 support area, but it remains at a risk of more losses.
-There was a break below a key bullish trend line with support at $12,100 on the 4-hours chart of the BTC/USD pair (data feed from Kraken).
-The pair could extend losses towards the $8,880 level if there is a successful break below $10,800.
Bitcoin price is holding the key $10,800 support area against the US Dollar. Having said that, BTC remains at a risk of more losses if there is no break above $11,600 and $12,000.
Bitcoin Price Weekly Analysis (BTC)
This past week, bitcoin price declined heavily below the $12,200 and $12,000 support levels against the US Dollar. The BTC/USD pair even broke the $11,500 support and settled below the 100 simple moving average (4-hours). However, the bulls were able to hold the key $10,800 and $11,000 support levels (as forecasted in the recent analysis).
The recent drop from the $13,182 swing high was initiated once there was a break below a key bullish trend line with support at $12,100 on the 4-hours chart of the BTC/USD pair. The pair even broke the 50% Fib retracement level of the upward move from the $9,708 low to $13,182 swing high. It opened the doors for more losses and the price even spiked below the $11,000 level.
However, the $10,800 support level holds the key and is protecting more losses. Moreover, there was no close below the 61.8% Fib retracement level of the upward move from the $9,708 low to $13,182 swing high. On the upside, an initial resistance is near the $11,500 level and the 100 simple moving average (4-hours). Above the 100 SMA, the price could face a strong resistance near the $12,000 level.
If there is a successful close above $12,000, the price could start a fresh increase towards the $12,400 and $12,500 levels. Conversely, if the bulls fail near $11,500 or $12,000, there could be another dip. More importantly, there is a risk of a downside break below the key $10,800 support area. In the mentioned case, the price could test the $8,880 support area. It represents the 1.236 Fib extension level of the upward move from the $9,708 low to $13,182 swing high.
Bitcoin Price Weekly Analysis (BTC)
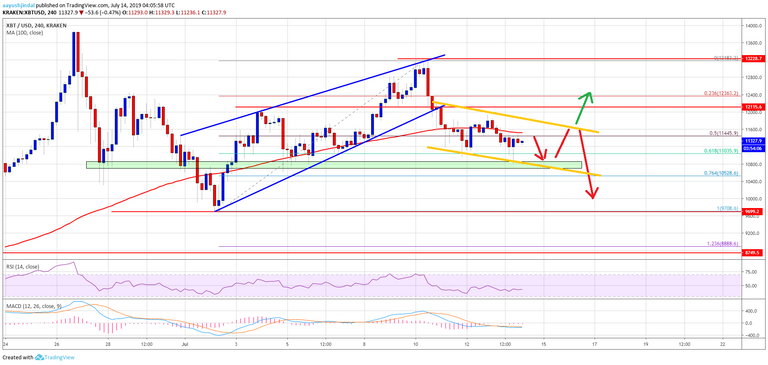
Looking at the chart, bitcoin price is clearly struggling to rebound above $12,000 and it could extend losses towards the $8,880 level if there is a successful break below $10,800.
Technical indicators
4 hours MACD – The MACD for BTC/USD is slowly moving in the bearish zone.
4 hours RSI (Relative Strength Index) – The RSI for BTC/USD is currently well below the 50 level.
Major Support Level – $10.800
Major Resistance Level – $12,000
Source
Plagiarism is the copying & pasting of others work without giving credit to the original author or artist. Plagiarized posts are considered spam.
Spam is discouraged by the community, and may result in action from the cheetah bot.
More information and tips on sharing content.
If you believe this comment is in error, please contact us in #disputes on Discord
Hi! I am a robot. I just upvoted you! I found similar content that readers might be interested in:
https://businessemag.com/bitcoin-btc-price-weekly-forecast-risk-of-extended-drop-to-8880/