Hi everybody,
Wish you a full day of energy and efficient trading!
New day, new week, Bitcoin has been showing signs of bearish.
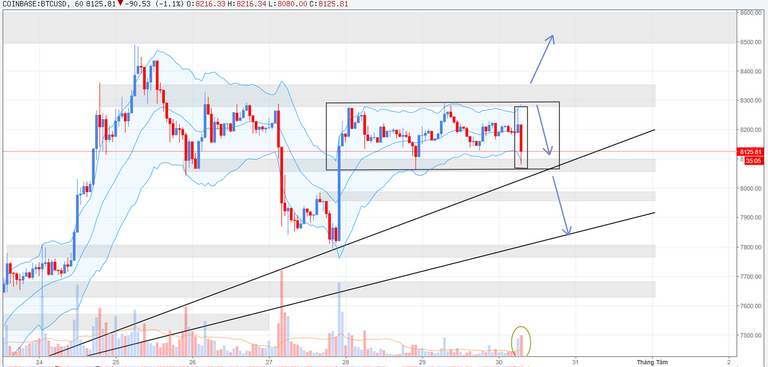
Signs are not stable through the last two 1 hour candles. Candles 6h-7h is a model shooting star - shot volume - with quite high volume, then followed by a strong candle reduction, the largest amplitude compared to the candles during the weekend. The volume of this candle is rising very high, although it is still more than 30 minutes to close. Only in the early days, there was a very strong force for bitcoin from 8k3 down
The 8k3 region as we have seen in previous analyzes is a very important area for short-term bitcoin. Must rise above 8k3 - 8350, the momentum of the new hope to return. The truth is that despite a strong pump on Friday night, bitcoin still can not bounce over this area and have to lighten again.
We have a accumulation area - now when prices move sideways. The effective strategy of the sideways is to buy below, above. However, due to the early fall, I prefer to sell from 8300 to 50 than buy from below. If break down to 8000 - 50, bitcoin will break this accumulation and can go back to bottom 7k8 in the coming time. If breaking up to 8350, the ability to retest 8k5.
The head is not swept, whether the tail reached the bitcoin this week?
Disclaimer: This is not investment advice.
THANK YOU FOR VISITING MY BLOG
FOLLOW ME TO SEE MORE OF MY ANALYSIS IN YOUR FEED