Stellar Price Analysis

Foreword/Introduction
This is an analysis that felt near-mandatory given the amount of fairly bullish news that has come across the wires for Stellar in the last couple of weeks.
As we’ve mentioned in some of our former price analyses, the partnership between IBM and Stellar has been the gift that keeps on giving in terms of the updates and developments that have been churned out from the pairing.
Most recently, Stellar investors were rewarded with the news that IBM is launching a ‘Blockchain World Wire’ payment system. In fact, that prior statement should not be put in the past tense, because the system is actually live as we speak.
It probably goes without saying, but this news is astronomical in terms of Stellar’s future potential (per usual). This is following the news that came out a little over a month ago informing investors and the general public alike that IBM would be building a stable coin atop of the protocol as well.
The reason why this news is bullish is because:
- It seriously validates Stellar as a blockchain protocol. It shows that Stellar has clearly met its goal to be utilized for a certain purpose as a BaaS (blockchain as a service) project in the cryptocurrency space.
- Stellar’s developments also provide credence to the idea that there is a specific ‘use case’ for cryptocurrency, in general, and that the business model that they are utilizing is the most effective way of facilitating such.
Now let’s have a look at the charts.
Stellar Price Analysis
We’re going to start with the XLM/USD pairings, but we’ll also have a look at the XLM/BTC pairing as well in this analysis.
https://www.tradingview.com/x/AqJa3mQX/
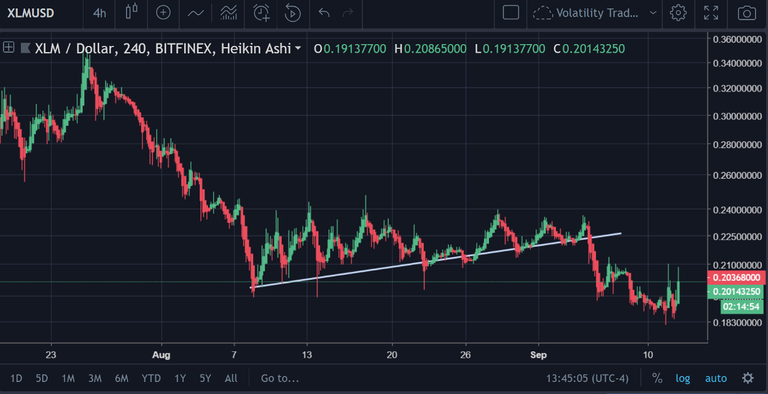
So, as we can see in the picture above, there was a point in time where Stellar was trending nicely against that uptrend line that had developed from the beginning of August.
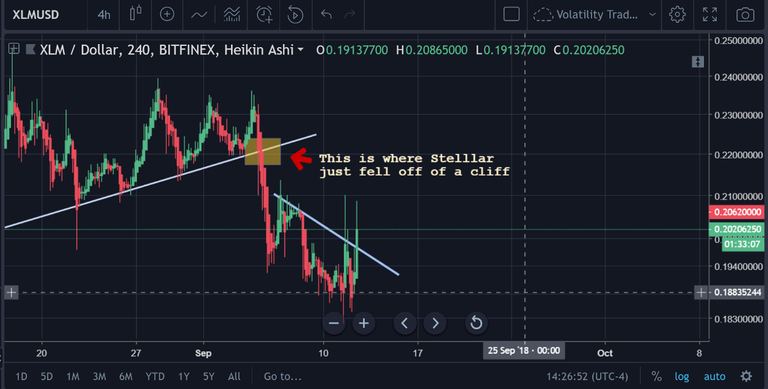
However, that line was unable to sustain the constant market dips, and it recently fell off of a cliff (in Stellar world, it did).
https://www.tradingview.com/x/H4OVXlep/
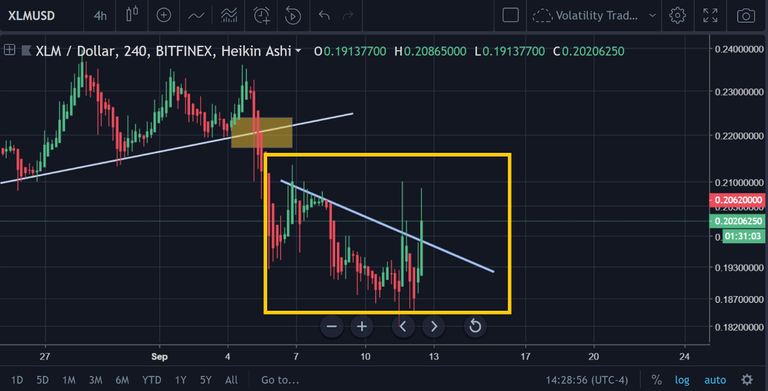
Let’s check out the apparent downtrend on the H4 chart below:
https://www.tradingview.com/x/csD82Ba4/
As you can see in the picture above, there are a few wicks that attempted to break through this downtrend, but they have been largely unsuccessful thus far.
Relative Strength Index (14)

https://www.tradingview.com/x/mK0lAJ75/
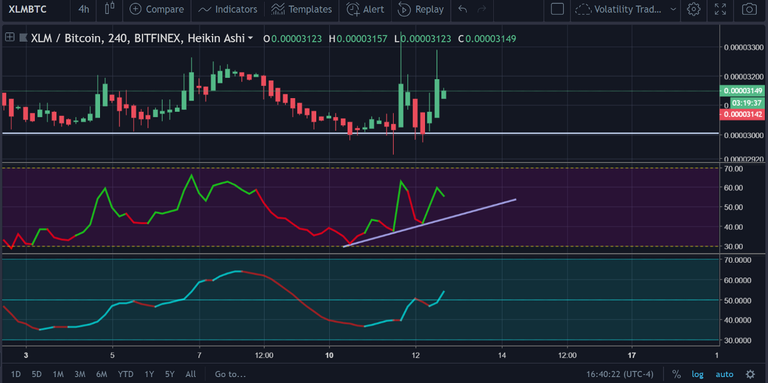
As you can see on the chart above, there is some serious divergence between the RSI(14) for Stellar and the price action on the H4 chart over the couple dozen periods or so.
The divergence is actually pretty substantial, all things considered, and definitely something worth paying greater attention to.
The Volatility RSI (on the third panel), is still signaling growth on the 4H as well.
Let’s Take a Look at the XLM/BTC Pairing

https://www.tradingview.com/x/bw39LwSr/
As you can see above, the BTC chart is a bit different than what we saw on the USD chart on the H4.
The two lines drawn in the chart above are used to show the minimum and maximums of the last few weeks of price action for Stellar.
It would appear as though Stellar has hit some sort of bottom point with BTC, although there is no guarantee that this is the case.
As has been stated numerous times in past price analysis articles, some coins appear to be more guided by TA done on the BTC charts, others more guided by TA on the USD charts. In the case of Stellar Lumens, it appears that USD dominates the future prediction for Stellar a bit more.
https://www.tradingview.com/x/5GRJXw86/
Again, as we can see above, the RSI appears to be on a fairly strong uptrend for Stellar Lumens on the H4.
Now, let’s go back to USD and up the chart resolution to the daily.
Daily Chart for XLM/USD Pairing
https://www.tradingview.com/x/nUJd8L0v/
So there are a number of notations that were made on the chart above, but we’ll explain those below (typing them out) for anyone that can’t see.
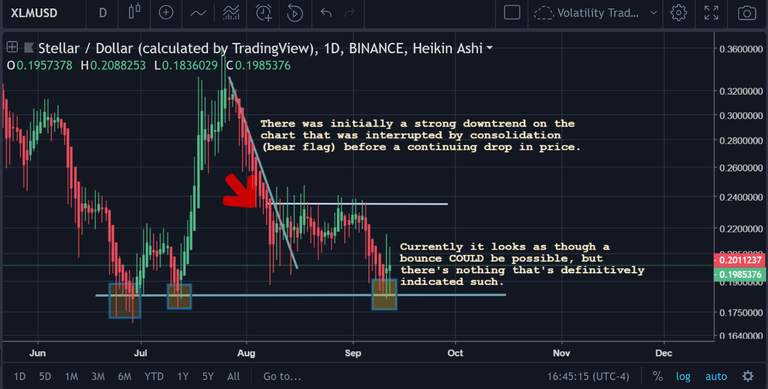
On the chart above you can see that:
- There was initially a strong downtrend on the chart that was interrupted by consolidation (bear flag) before a continuing drop in price.
- Currently it looks as though a bounce COULD be possible, but there’s nothing that’s definitively indicated such on the chart overlay itself.
For those that need a quick refresher on this course, here’s what a bear flag looks like:

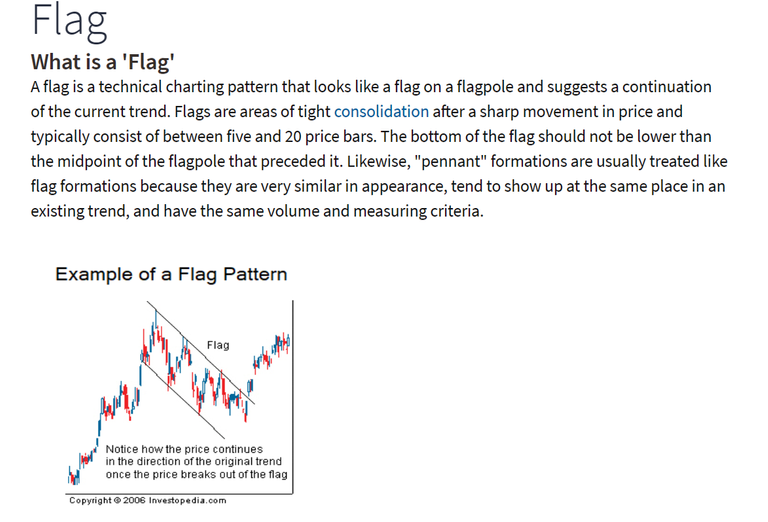
Source: https://www.investopedia.com/terms/f/flag.asp
It appears that the price is finally at a support on the daily chart as well.
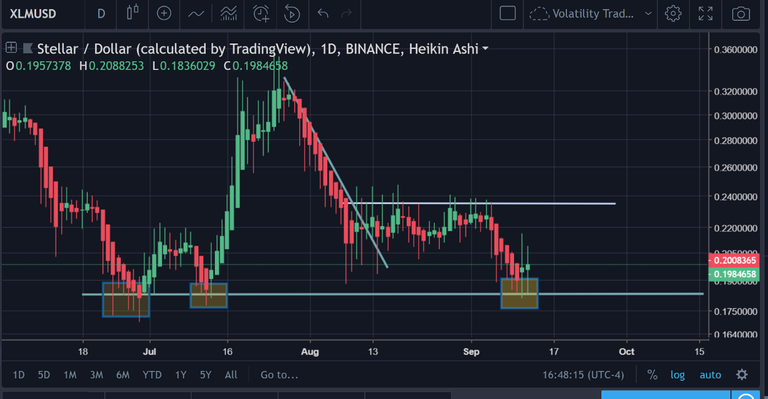
https://www.tradingview.com/x/4Ra2keSd/
The idea that the price has finally hit a support is evidenced by the three translucent boxes that you see on your screen above.
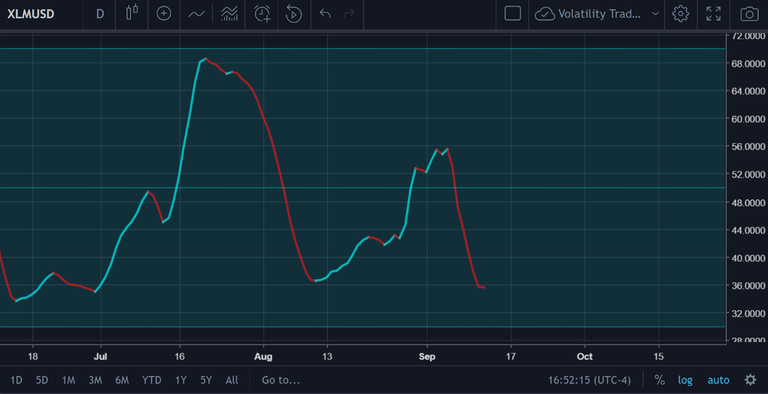
RSI(14) Still Bearish on the Daily Though; Something to Consider
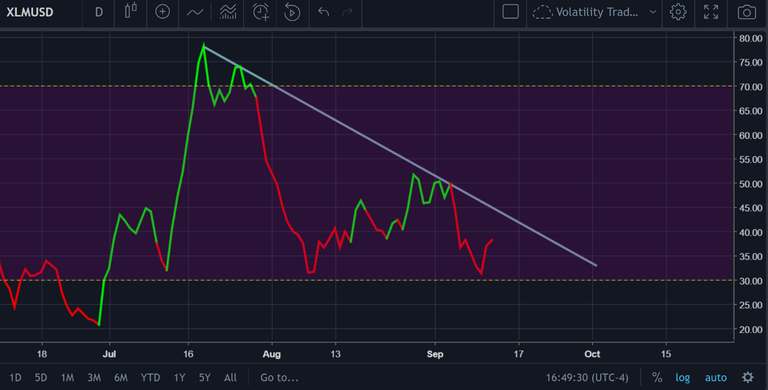
https://www.tradingview.com/x/lnjxNyoN/
This is important to note, because we saw a significant amount of (positive) divergence on the lower TF charts and that’s usually a auto-long position type of signal.
However, knowing that the same cannot be said of the daily should give traders pause. Or, at the very least, it should indicate to traders that the divergence on the lower time frames has not been sustained for enough periods on the H4 (and below) to translate to the daily chart.
Therefore, if one were to place a long bet on Stellar Lumens at this point in time, it should be done so with caution and prudence, because it has not been entirely immune to the downward thrusts in the market as of late.
https://www.tradingview.com/x/TxPPgfjh/
The Volatility RSI hasn’t even signaled us in yet.
Moving Average Convergence Divergence (MACD)
https://www.tradingview.com/x/J24FxFys/
The MACD looks a bit ambiguous, perhaps even somewhat ‘shy’ on the daily chart, but the MACD line itself appears to be attempting to make a move upward.
We can see on the Histogram in the above chart that the bars are reflecting a rate of decline.
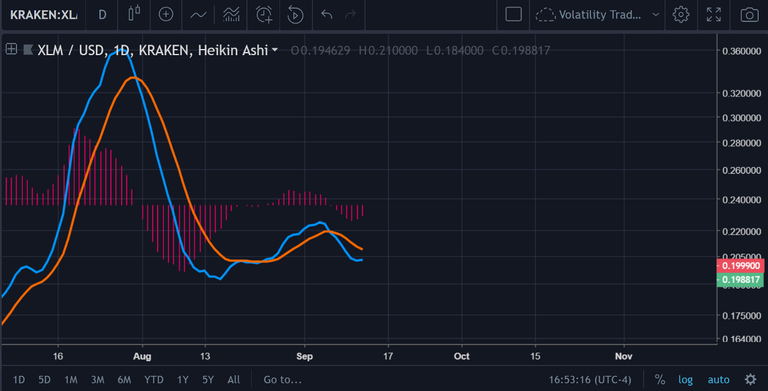
Moving Fib Indicator (Custom)

https://www.tradingview.com/x/J9ev1KdU/
On our moving Fibonacci indicator, we can see the next ‘zone’ ends at 22.6 cents, which would be +10% growth from where it is currently.
Conclusion
There is definitely some underlying bullish sentiment in Stellar on the lower time frames.
However, it remains to be seen whether that bullish sentiment will continue and be substantive enough for it to break the market’s overall trend.
For those that have been following the markets closely over the last few days, it hasn’t been Bitcoin that’s declined in value, but rather altcoins themselves and this has resulted in a greater market dominance for BTC overall (per CMC data).
The fact that Stellar has been able to withstand that is already bullish in it of itself.
A long bet appears to be a bit of a gamble in this situation, but it seems a lot safer than a short bet (if you have the option of shorting this project). If the author was forced to enter into a position on this coin, then here’s what their R/R would look like:
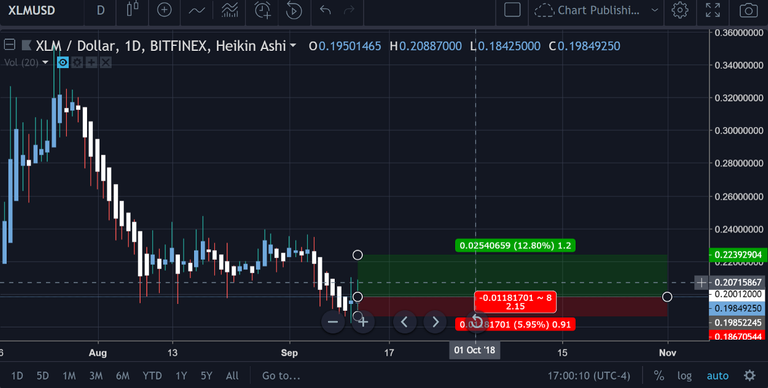
https://www.tradingview.com/x/ZalMt5vn/
Please note, this is not financial advice in any way, shape or form. Make your own decisions about how you wish to proceed forth with this trade.
Good luck!
Disclaimer
This article is not financial advice. The author is not a financial advisor and this article was not paid for.
For more information like this, join/follow our Website, Telegram, Discord, Steemit, Reddit, and Twitter!
This Analysis Was Also Posted On:
Website = https://blog.zerononcense.com/2018/09/12/stellar-price-analysis-9-12-2018/
Steemit = https://steemit.com/bitcoin/@proofofresearch/stellar-price-analysis
Medium = https://medium.com/@proofofresearch/stellar-price-analysis-c83da46b88d7
TradingView = https://www.tradingview.com/chart/XLMUSD/yDh74NCv-Stellar-Lumens-COULD-Be-Bullish/
Stellar looked great today.
Posted using Partiko iOS