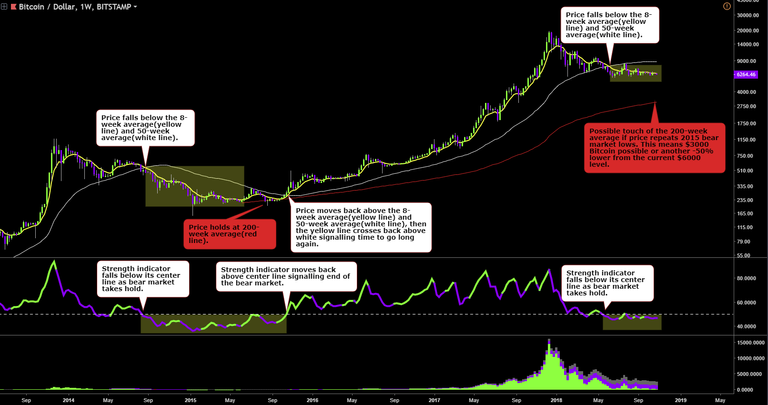
First, price trends below the weekly trigger line(8-week average, yellow line), then price and the trigger line move below the 50-week average(yellow line crosses below white line). At the same time, the strength indicator below the chart moves below its center line signalling a bear market. If the 2014-2015 fractal continues to repeat we have many more months of this bear market to go and a dip to the 200-week average near $3000 before support will finally be found. Watching global equities tank this month I wouldn't be surprised to see traditional stock traders dump their risk assets(crypto). It's hard being a bear in a bullish community, but gotta respect the charts. Doesn't take a genius to know that the trend for 2018 is down, so far no signals have appeared to suggest that the bear market is over or even done going lower.
Congratulations @ripper1! You have completed the following achievement on the Steem blockchain and have been rewarded with new badge(s) :
Click here to view your Board of Honor
If you no longer want to receive notifications, reply to this comment with the word
STOPDo not miss the last post from @steemitboard: