Bitcoin soared to $ 11,700 this week (data source: huobi) ushered in a callback, as of this article release time, btc has dropped to 9,612 US dollars.
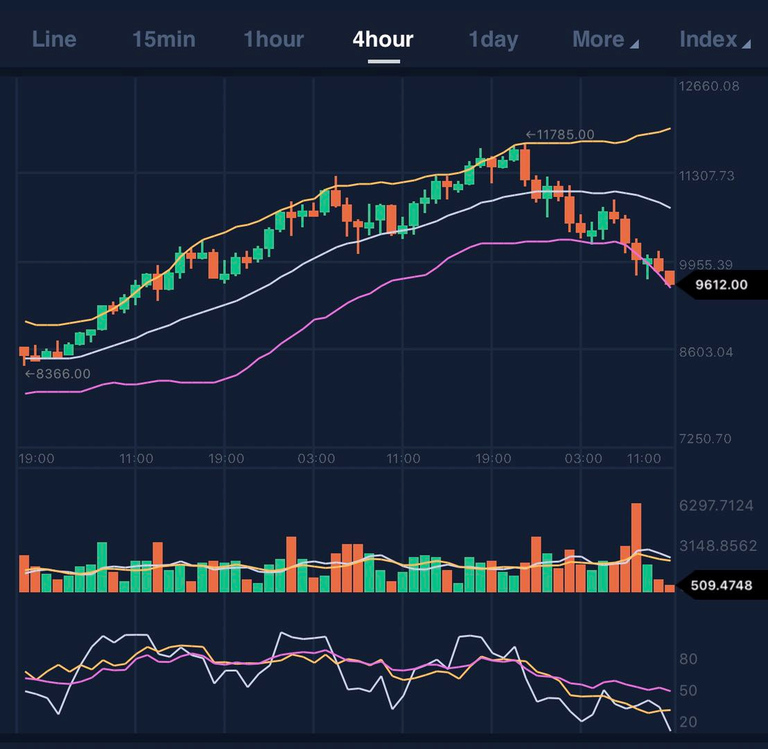
On short-term terms, Bitcoin started running the lower Bollinger Band (B4) for 4 hours about 12 hours ago and now shows signs of oversupply at $ 9,600, while the rsi6 and rsi12 indicators also show oversold . A big rally is expected at the 9500, 9300 and 9000 support points, but the probability of this wave bouncing back above 11500 is small, and the next wave of collapse will be ushered in after the rally.
MACD indicators on the daily point of view, this decline is only the beginning. The upcoming rebound of Bitcoin will be an excellent sell or short opportunity. As shown, MACD line in the yellow line when crossing the two lines is a good selling point.
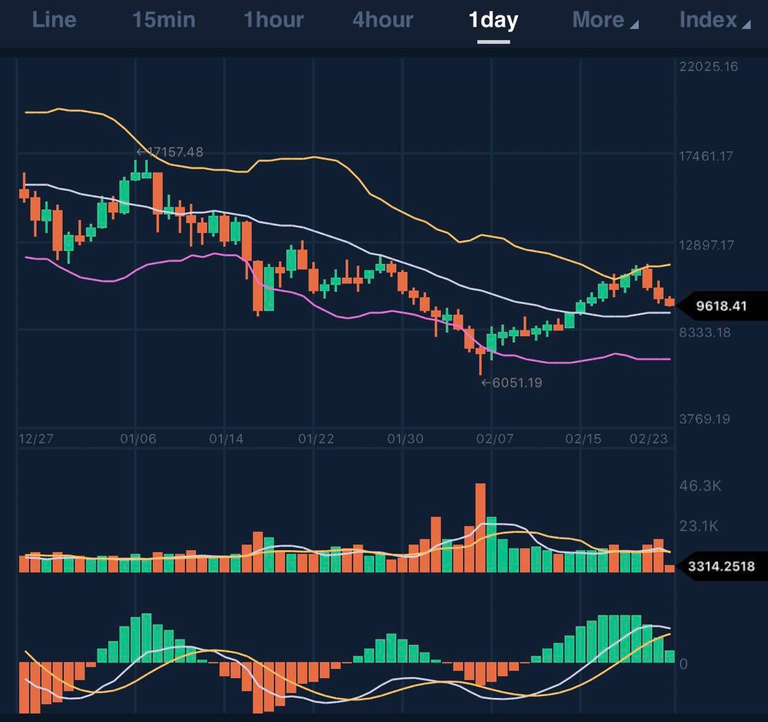
Bitcoin is a bull or bear market, it is still not clear. If the upcoming rally breaks through new highs, it is a bullish signal, but I personally find this unlikely.
Position recommendations:
Short-term: being short in bitcoin rebound high point, personal prediction: if bitcoin is still in the bear market, the high point will be 10200 to 11000 (depending on the location of the support point when bitcoin falls).
Long-term: Reduce the investment in bitcoin before the bitcoin's rise and fall are clear.
Thank you for reading my analysis, my English is not good, I hope it does not affect your reading.