Hi everybody. I'd like to share with you what I'm seeing in the markets. I'm sure there's many out there who are wondering where this market is going. I find that turning to the charts is the best way to gage what exactly the market is doing in the present time. I hope you find this perspective as useful and calming as I do.
For now I'd like to focus on bitcoin. Where bitcoin goes, so will the rest of the market.
This is a 30 minute chart for today's BTC price action. The clear resistance/support line at the $2150 level has been in play all throughout the day.
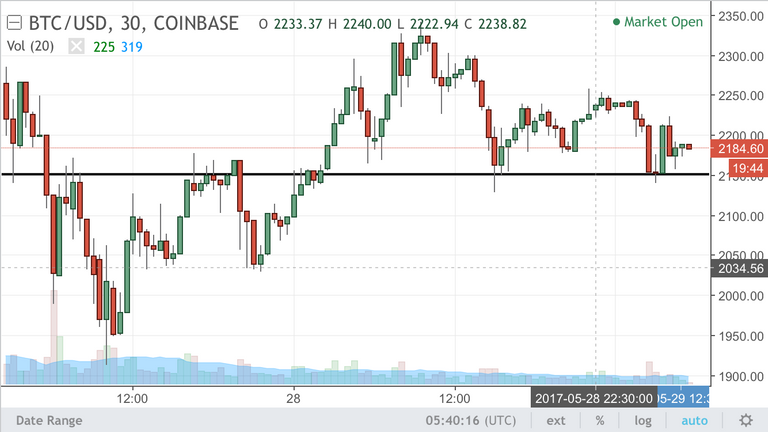
We can clearly see that multiple times in the morning BTC was unable to break above $2150 as indicated by the red arrows. On it's third attempt it decisively broke through this resistance, eventually making it's high of the day at $2325. The breakout is indicated by the blue arrow in the chart below. As expected, bitcoin would again retested the $2150 level, this time finding support and bouncing off of it. This is indicated in the chart below with the green arrows.

This is generally a bullish sign that bitcoin has put its short term bottom in and is beginning to exhaust the bears.
Now, what I'm seeing is the short term action consolidating into a pennant formation. The upward trendline from today's low and the downward trendline from today's high are converging into the tip of the pennant. This consolidation will have to break either to the upside or the downside.
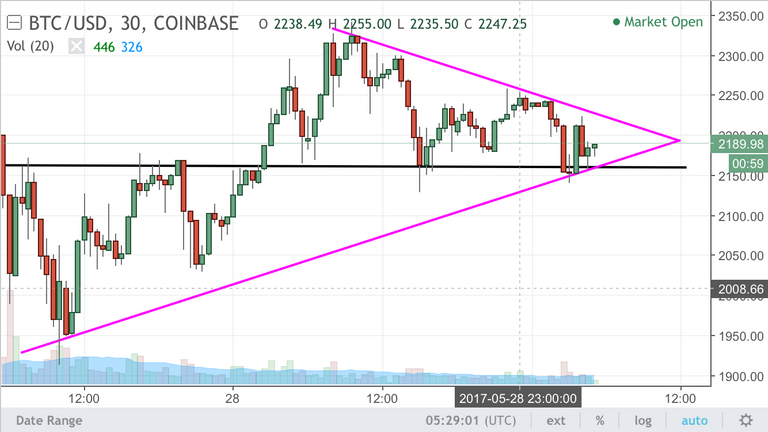
The direction that ultimately plays out here should determine the overall trajectory of tomorrow's action. Lets hope it's to the upside!
thanks for sharing
You got it... I hope it's helpful to you!
Do not worry a bit. You see, we have yet to see the the actual influx of flight to safety still. There is no doubt in my mind that the meat of Bitcoin is still ahead of us.
I agree!