
BTCUSD
Happy Halloween, also woo wee, BTCUSD hanging onto its highs like a little kid and his pillowcase full of candy.
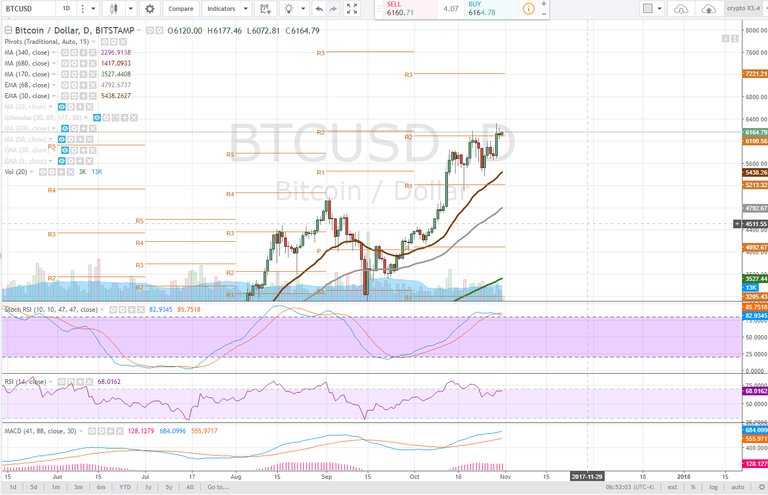
Daily
The price broke above pivot R2 after putting in a seemingly obvious H&S that didn't result in a bearish reversal, though the pattern is quite obvious. This is known as a fake out, the price never broke below the neckline. It is essential for the bulls to continue to hold R1 and consolidate on it, turning this level into support. Its clear skies above that on the daily time frame with pivot r3 being the next bull target if the bullish momentum maintains.
The Stochastic RSI is in up trend and a larget divergence in the MACD may require further price consolidation before heading higher. The RSI is hovering just below overbought and should the price pullback, bulls would look for the 30ema to act as support.
4 hour
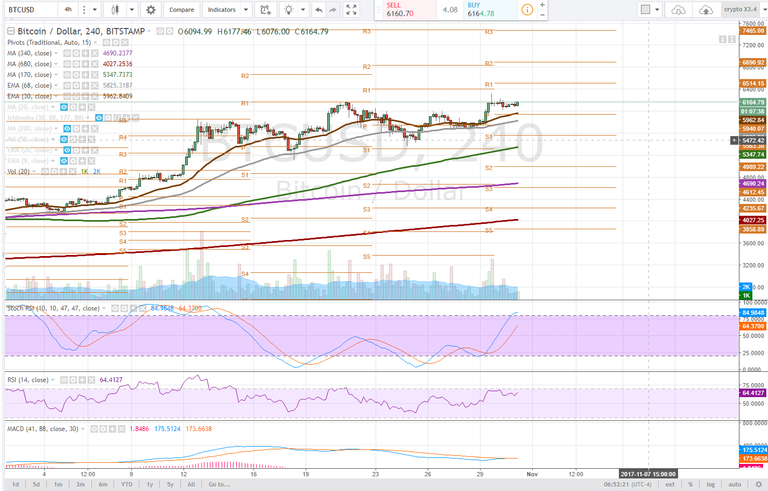
The 4 hour time frame is showing us more rectangle consolidation in what appears to be a bull flag. The pivot hasn't been tested on this time framed and would be a key support should the price pullback during consolidation. The 30ema and 68ema as well will act as support.
On the upside, bulls are looking for BTCUSD to keep setting new all time highs, with a more conservative upside target on this time frame being pivot R1, $6514.
A bullish MACD cross on this timeframe appears inevitable with the Stochastic RSI just having entered uptrend and the RSI clearly trending higher.
All shorter term moving averages are above longer and the first real bearish signal will be a bearish moving average cross.
1 hour
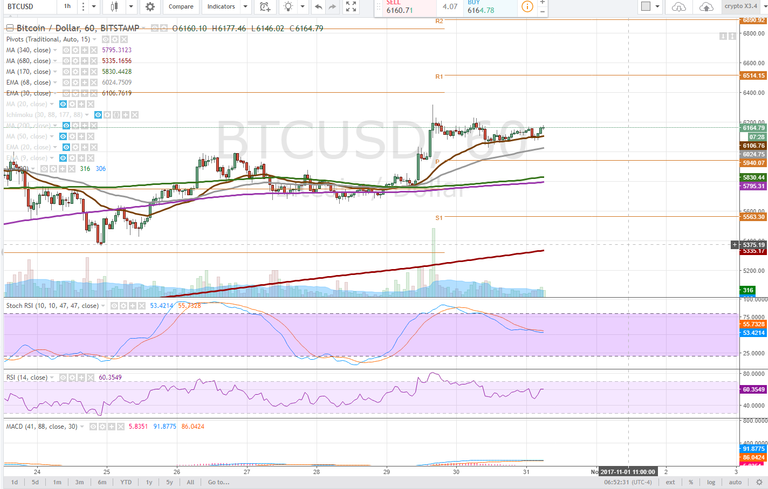
On the 1 hour time frame our areas of support and resistance become even clearer as you will observe the price clearly hugging the 30ema. It will be essential for the moving average to continue acting as support to observe shorter term price progression. If the 30ema fails, bulls would look to the 68ema, and pivot on this time frame as their last line of defense. The chart remains bullish as long as the 30ema is above the 68ema.
The stochastic RSI is trending down through this consolidation phase and the RSI is relatively neutral. The MACD appears like a bearish cross is impending, however, we are not seeing the volume, yet, for it to be overly concerning.
Bullish Above: $6240
Bearish Below: $5940
RISK TRADE: Buy on a breakout of the bull flag, use stops in case it's a fake out.
Don't forget to use stop losses!!!
Previous Articles:
ETHUSD
ZECUSD
LTCUSD
BTCUSD
ETHUSD
BTCUSD
LTCUSD
Follow at your own risk, Not a financial adviser, understand the risks associated with trading and investing. Manage your own Risk - in other words you could lose it all and it's your own fault.

Can't see the screen shot :/
must be an issue on your end friend i see them on mine. Try clearing your browser cache or using a different browser.
I think it will keep rising until the fork
quite possibly, the bull flag on the 4 hour is clear so as long as we continue to see higher low, and higher highs, price remains bullish my indicator of when to flip bearish would be on a bearish moving average cross.
I think there is going to be a big correction after the fork, with a low target of 4000/4500
I think thats fair, procing in codebase upgrade. I dont know when the jext fork is, but yes its a known event that should be percoeved bullish and therefore get priced in
Wow thanks for your good information
tout a fais normal c'est le bitcoin