
DASHUSD - Day Traders Chart Setup
Moving averages:
Green = 50dma
Red = 200dma
Orange = 9ema
Black = 20ema
I will go back and forth to the swing traders chart setup I had been using before once the volatility cools in BTCUSD. Nearly 8k wow, i hope everyone was following along cause if you did, boy did we nail it.
Lets start looking at major alt coins again, for starters DASHUSD.

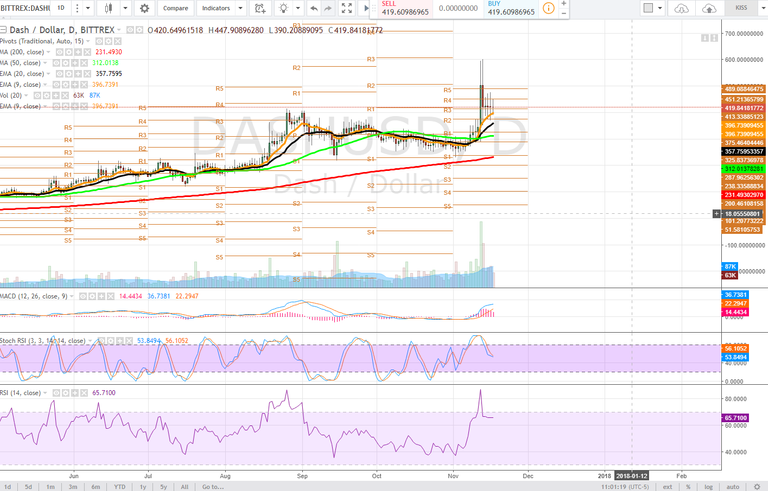
Daily
On the Daily chart we have what can be viewed as a bullflag forming, thought the wicking of each candlestick suggests we are currently fairly priced with supply and demand seeming to find equilibrium in this price range just above Pivot r3. The price of dash finds support at the 9ema and it will be important for this level to hold. If it doesnt working on the 20ema is likely and would be the critical level to hold.
Dash did set a double top with that insane run to $600.
Looking at the stochastic RSI it has begun its downtrend cycle but the price maintaining this level is a very bullish sign. The RSI howver reached extreme overbought conditions before correctly sharply and we see the MACD is beginning to curl. The biggest take away from this chart is the price being above all moving averages is bullish and needs to be maintained for continuation
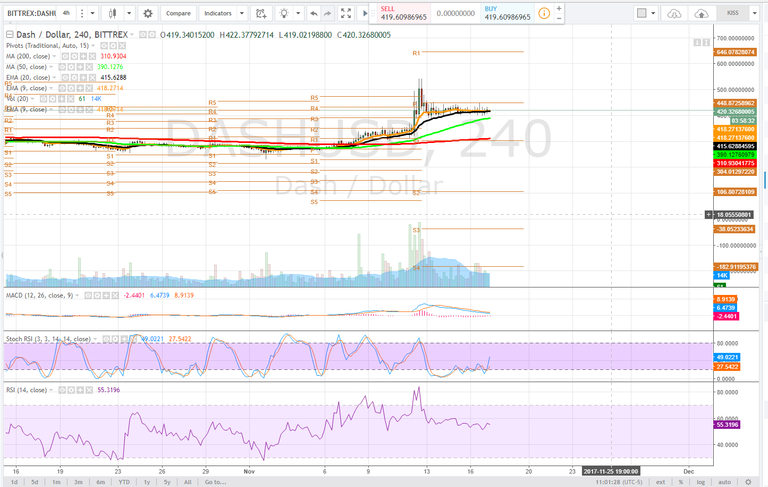
4 hour
The 4 hour time frame is quite a bit more interesting with the stochastic RSI showing the tight range volatility and potentially ready to enter a full uptrend cycle. This is very crucial to price progression as the MACD has begun to trend to zero line where it ideally finds support. The price must hold the 9 & 20 ema to allow the full stochastic cyle to happen and flourish. The price is currently in a tight range between the EMA's and the pivot on this time frame. The pivot has been an area of resistance and is our first target. However, as the 50dma converges with the 9 & 20ema bulls need to be careful of a bearish cross here. Volume needs to come in to preserve this move. Losing the 50dma will see a retrace to possibly the 200dma which converges with the pivot support S1.
The RSI is in a healthy range and trending sideways much like the price.
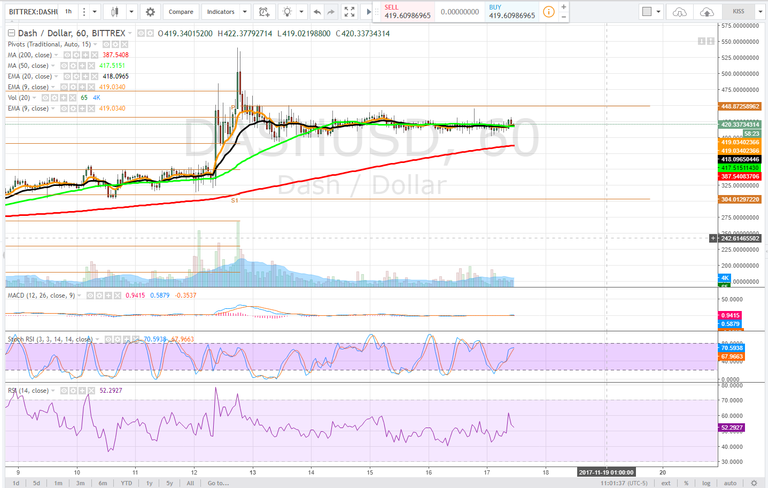
1 hour
On the 1 hour time frame our stochastic RSI looks quite shakey and has a curl to it that suggests bearish momentum is keeping pace with the bulls on this time frame while the macd is effectively in a neutral range. The RSI is trendless.
The 9ema, 20ema & 50dma have all converged and are currently providing strong price support. Losing these moving averages will result in a test of the 200dma on the 1 hour. Possibl buying opportunity if the bulls show up. How do we confirm? If the price hits the 200dma, bulls will need to see it bounce and a followup green candlestick to confirm buying pressure. This is our target entry.
Bullish Above: $441
Bearish Below: $405 -- edited for typo
RISK TRADE: Open a position at the 200dma on the 1 hour time frame approximately $307, conversely if the price breaks out buy on bullish confirmation above $440 - that's the 4 hour pivot.
Don't forget to use stop losses!!!
Previous Articles:
BTC Vs. BCH - Intrinsic Value
BTCUSD
ETHUSD
BTCUSD
BCHUSD
BTCUSD
ZECUSD
XRPUSD
ETHUSD
BTCUSD
BCHUSD
Follow at your own risk, Not a financial adviser, understand the risks associated with trading and investing. Manage your own Risk - in other words you could lose it all and it's your own fault.

Nice analytics
I enjoyed your post! keep publishing interesting and informative analysis.
waooo satchmo damgood @abdulsalim
I might start trading after reading your articles, love it, keep it up
great work @satchmo
super November aynalaiz atricle
You are awesome. Keep up the good work
good presentation...the market keep fluctuating...
I believe that Dash will continue its bullish average growth towards the 800 US $, to then cause an abrupt fall to US $ 400 with regular stabilization. The market for cryptocurrencies is still moving under a speculative scheme and I do not think it is stochastic at all. The Bitcoin / BitcoinCash pair will continue its advance with alternating ups and downs, but with a growth envelope for both.
The Stochastic RSI purely is a tool to measure velocity and strength of a trend which can be a short period or long.
A
.
?
?
.
.....
.....
.
Good points in this article.
Visit CoinCheckup.com | SteemIT - Daily Technical Analysis