
ETHUSD
With BTC going parabolic and reaching new All time highs it is still important to keep our eyes on ALT currencies. Today we will look at ETHUSD as we have been tracking the wedge formation for some time now.
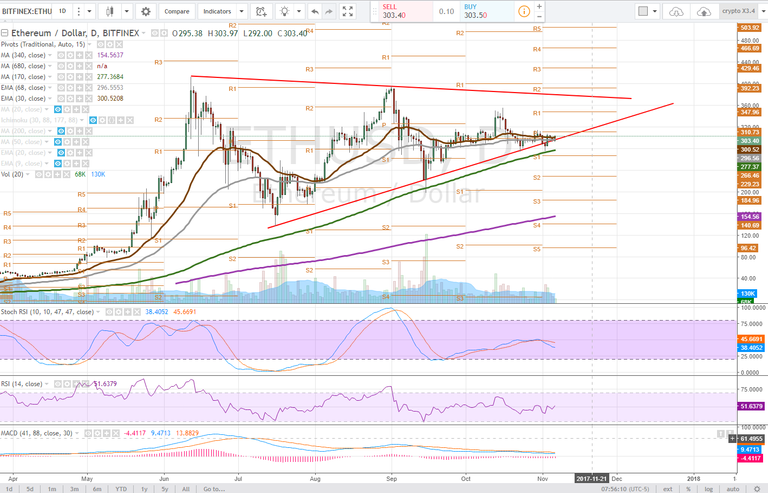
Daily
The price of ETHUSD briefly broke the lower trendline before catching support just above the 170dma on the daily time frame. Maintaining this wedge formation is extremely condusive to price progression.
The stochastic RSI and RSI have continued to trend sideways as the moving averages converge to a tighter range. The MACD is hanging just below the zero line as the 30ema and 68 ema are proving to be a difficult resistance to break above. Bulls are looking for the price to claim the 30ema as support and test the daily pivot, $310.73
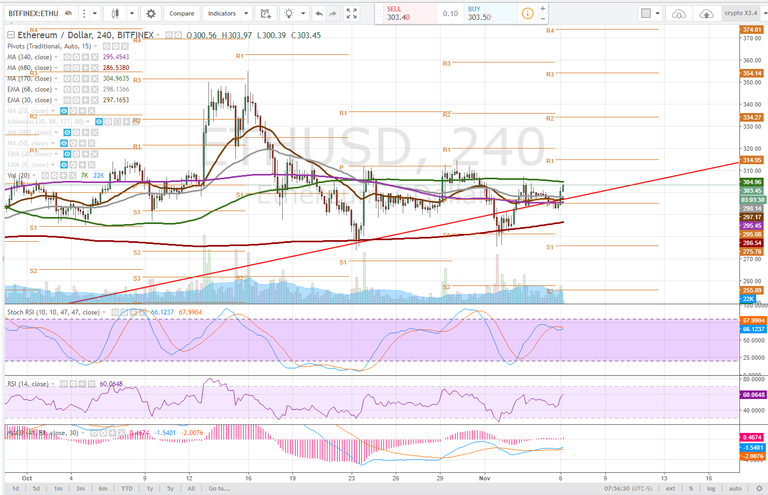
4 hour
On the 4 hour time frame the Stochastic RSI and RSI have begun to trend upwards after a bullish MACD cross. Resistance is clearly observed at the 170dma. This is a critical level for bulls to reclaim after the price tested and bounced off of the 4 hour pivot. It is also observed that a double bottom was set at approximately the 680 DMA on this time frame. Should the price pullback and lose pivot support, it is critical that the 680dma be maintained. If the price can reclaim the 170dma bulls should look for a test of pivot r1 on this time frame and look for consolidation thereafter, approximately $314.
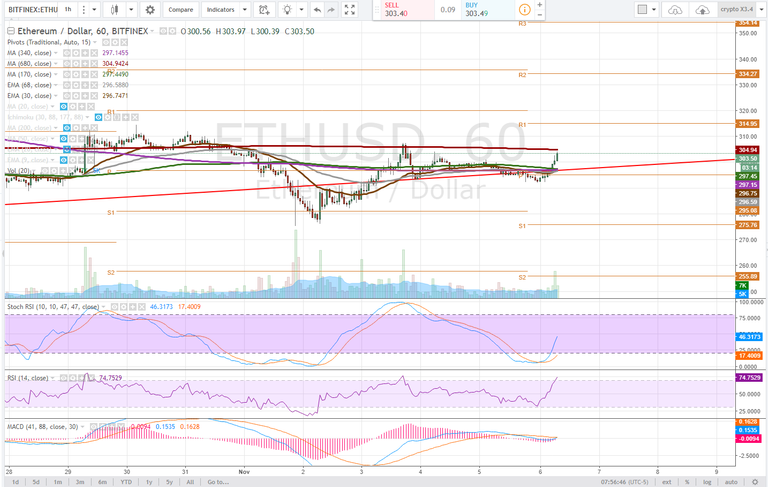
1 hour
The 1 hour time frame is most interesting with a bullish MACD cross appearing to be imminent as the stochastic RSI has curved steeply upwards. Some caution is warranted as the RSI has just reached overbought. An increase in volume has led this shift in our momentum indicators and resistance is observed at the 680dma on this time frame. A bullish convergence of the other moving averages is underway and continued momentum will drive the 30ema and 68ema upwards to act as price support. This has all occurred again after testing the pivot on this time frame.
Pivot R1 is as well $314 on the 1 hour and would be a reasonable target to look too before price consolidation if the bulls can maintain this momentum.
Bullish Above: $305
Bearish Below: $294.50
RISK TRADE: Scale into a long position and be ready to add on a break above $305 or close if the price loses pivot support on the 1 hour time frame.
Don't forget to use stop losses!!!
Previous Articles:
BTCUSD
BCHUSD
ZECUSD
LTCUSD
BTCUSD
ETHUSD
BTCUSD
LTCUSD
XMRUSD
Follow at your own risk, Not a financial adviser, understand the risks associated with trading and investing. Manage your own Risk - in other words you could lose it all and it's your own fault.

Good technical analysis.👌💯
Upvoted & RESTEEMED!
Is there any adviser to manage some risk or fault? Other wise it is quite hard to do all that things that you have mentioned in your post.
You are the manager of your own risk and fault. Technical Analysis is not black and white, merely predictive. There are tools and methodology available to you in order to limit risk. If you do not understand that anything you do in investment or trading, crypto or any other asset involves risk, you should not be trading or investing. It's really simple.
The summary of the post is to long above threshold X or liquidate/Short below threshold Y and use stoplosses to limit risk. It is not hard to do.
Yes, earlier i thought it is hard process, Thanks for sharing this information. keep steeming brother. regards
You are right, it is definitely not easy, nor for the faint of heart. I try to provide longer term swing trade setups, the gains are less, but so are the losses, my goal is to also potentially help people learn to perform technical analysis.
That's totally is an awesome thinking, I appreciate that. Keep continue brother. want to see this types of more posts from you that we might learn something important information's from you
we cant say that either bitcoin go up or zero
not sure what you are trying to say.
i mean to say that we can not predict value of biitcoin either it will gain or lose.
Well actually technical analysis is using the statistics of price action to predict future expected value through probabilities.
Congratulations @satchmo! You have completed some achievement on Steemit and have been rewarded with new badge(s) :
Click on any badge to view your own Board of Honor on SteemitBoard.
For more information about SteemitBoard, click here
If you no longer want to receive notifications, reply to this comment with the word
STOPhello ever body
https://steemit.com/bitcoin/@laciri/btc-8-updated-today-for-the-price-of-btc-06-11-2017
Upvotd
Congratulations @satchmo! You have completed some achievement on Steemit and have been rewarded with new badge(s) :
Click on any badge to view your own Board of Honor on SteemitBoard.
For more information about SteemitBoard, click here
If you no longer want to receive notifications, reply to this comment with the word
STOP