
I believe that it is possible to beat the market through a consistent and unemotional approach. This is primarily achieved through preparing instead of reacting. Click here to learn more about the indicators I use below and click here from my comprehensive trading strategy. Please be advised that I swing trade and will often hold onto a position for > 1 month. What you do with your $ is your business, what I do with my $ is my business.
My most recent Bitcoin Bubble Comparison led to the following predictions: 1 day - 28 days = < $5,750 | bottom prediction: $2,860 by 10/30
Previous analysis / position: “It still feels too early to breakdown $6,150 support. I feel like we need to range for another couple days or bounce up to the 12 EMA.” / Short ETH:USD. Took profit on 33% of position improving my average cost basis to $317.37 per ETH.
Patterns: Descending triangle
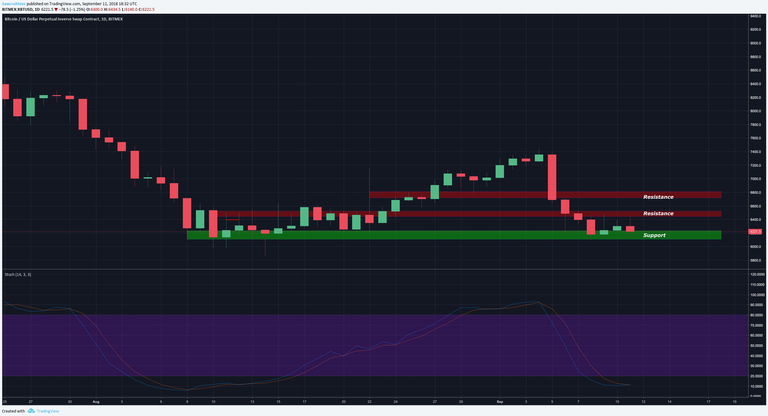
Horizontal support and resistance: S: $6,151 | R: Is $6,250 support becoming resistance?
BTCUSDSHORTS: Found support at 35,668 and is bouncing off a dragonfly
Funding Rates: Shorts pay longs 0.0203%
12 & 26 EMA’s (calculate % difference): 12 = -4.72% | 26 = -6.58%
50 & 128 MA’s: 50 = -9.87% | 128 = -12.19%
Volume: Still below MA but it is very early in the day, expect this candle to have high volume
FIB’s: 0.886 = $6,137 | 0.786 = $6,383
Candlestick analysis: Long wicks on daily candles indicate indecision and upcoming volatility. Current daily candle will be bearish engulfing if it closes < $6,237
Ichimoku Cloud: Tenkan = $6,765 | C clamp on 4h
TD Sequential: 12h & 4h recently had R2 < R1. Daily on R7
Visible Range: Currently testing point of control (POC) with 2m - 1y lookback.
BTC Price Spreadsheet: 12h = -1.9% | 24h = -1.11% | 1w = -15.56% | 2w = -11.47% | 1m = +1.54%
Bollinger Bands: Bouncing from bottom band. Retesting MA at $6,768 is to be expected.
Trendline: N/A
Daily Trend: Chop that seems to be favoring bears
Fractals: Up = $7,426 | Down = $5,866
On Balance Volume: Can see a small bull div when looking back to the middle of august. OBV has higher low and price has double bottom.
ADX: Bear trend
Chaikin Money Flow: Shows same div as OBV
RSI (30 setting): W = 48.44 | D = 43.48
Stoch: Buy signal right now. Notice how the last time we got a daily buy signal the price proceeded to make a fakeout lower low before finding support and rallying.
Summary: BTC looks like it has found support and should bounce to the $6,750 area before continuing the downtrend. However, alts are currently breaking down and there is a good chance that they drag BTC down with them.
I watch ETH’ as my leading indicator for alts and it has broken down $200, testing it for resistance and continued to break down from there. At the time of this writing it just broke down $180 and 0.029.
Over the next few days I believe the play is shorting EOS:ETH. For TA on EOS please see: The Most Overvalued Coin in Crypto: EOS
Thanks for reading!

Allow me to Reintroduce Myself...
Learn How to Trade! [part 1]
Learn How to Trade! [part 2]
Wyckoff Distribution
Bitcoin Bubble Comparison
The Most Overvalued Coin in Crypto: EOS
Bitcoin Daily Update (day 195)
Coins mentioned in post: