
I believe that it is possible to beat the market through a consistent and unemotional approach. This is primarily achieved through preparing instead of reacting. Click here to learn more about the indicators I use below and click here from my comprehensive trading strategy. Please be advised that I swing trade and will often hold onto a position for > 1 month. What you do with your $ is your business, what I do with my $ is my business.
My most recent Bitcoin Bubble Comparison led to the following predictions: 1 day - 28 days = < $5,750 | bottom prediction: $2,860 by 10/30
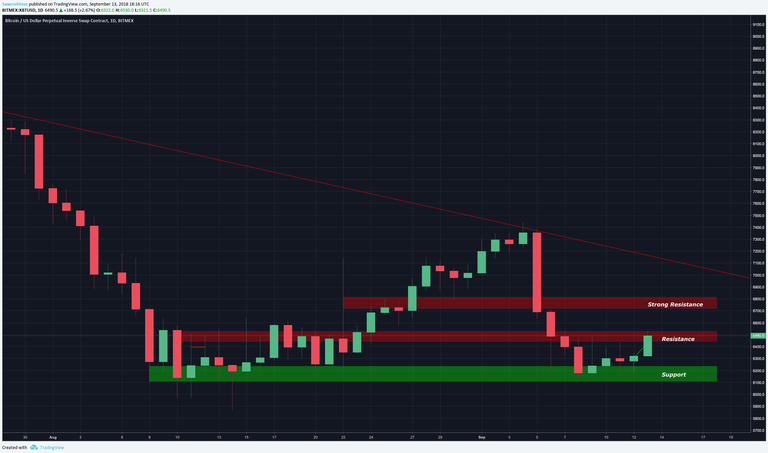
Previous analysis / position: “There is nothing to do at this point other than to wait. Ideally we will get a sharp spike to $6,700 before breaking down...If that doesn’t happen then we will likely continue to consolidate for days - weeks.” / Closed ETH:USD shorts due to high volume dragonfly doji from yesterday’s close. Using 5:1 leverage that position returned +147.85% in 12 days.
Patterns: Descending triangle
Horizontal support and resistance: R: $6,525 & $6,777 | S: Will it turn $6,425 into support??
BTCUSDSHORTS: Will it create a lower high or higher low? | Most of the shorts are on Bitfinex and most of the longs are on Bitmex. Since Bitfinex only allows 3.33X leverage I think the longs are in more danger of getting squeezed/liquidated.
Funding Rates: Shorts pay longs 0.007%
12 & 26 EMA’s (calculate % difference): Current candle is retesting 12 EMA for resistance. 26 = -2.26%
50 & 128 MA’s: 50 = -5.15% | 128 = -7.95%
Volume: Still waiting for volume spike to define the next move.
FIB’s: 0.618 = $6,610 | 0.5 = $6,767
Candlestick analysis: Currently forming bullish extended range candle.
Ichimoku Cloud: Tenken-Sen = $6,772
TD Sequential: G2 > G1 is providing entry, however I would stay away due to trading against the trend and unfavorable risk:reward ratio. 4h is currently on a 7 and indicates a correction in about 10 hours.
Visible Range: High volume node at $6,511 with 2 month lookback.
BTC Price Spreadsheet: 12h = +1.86% | 24h = +3.58% | 1w = +/- 0 | 2w = -7.44% | 1m = +3.16%
Bollinger Bands: A return to the MA at $6,743 is to be expected after bouncing from the bottom band
Trendline: Top end of descending triangle will waiting around $7,000
Daily Trend: Bullish
Fractals: Up = $7,475 | Down = $6,065
On Balance Volume: Moving up with price / no div’s
ADX: Bear trend with -DI and +DI converging.
Chaikin Money Flow: Turning over and potentially creating a bear div’
RSI (30 setting): W = 49.03 | D = 46.72
Stoch: Bearish re cross on weekly with buy signal on daily
Summary: This is the bounce that I have been waiting/hoping for. After closing out the rest of my shorts I am ready to re open at a better price. Now it is very important to remain patient and not enter too early. According to the TD Sequential this bounce still has 7 days left.
However, I am not sure if we will get to a 9 on this rally due to the following resistance cluster that is waiting from $6,743 - $6,887:
Tenken-sen = $6,772
0.5 = $6,767 (also 50% point of extended range weekly candle)
50 MA: $6,836 and angling downward
Gap in the volume profile. Low volume node at $6,800 could place the resistance as high as $6,887
Bollinger Band MA = $6,743
I will continue with my approach of watching BTC and trading ETH. ETH looks like it should bounce to $240 - $250 before continuing it’s downtrend. That area provided significant support in the past and should turn into significant resistance moving forward.
I am also planning on opening large shorts on EOS:BTC and EOS:ETH based on this analysis.
Thanks for reading!

Allow me to Reintroduce Myself...
Learn How to Trade! [part 1]
Learn How to Trade! [part 2]
Wyckoff Distribution
Bitcoin Bubble Comparison
The Most Overvalued Coin in Crypto: EOS
Bitcoin Daily Update (day 196)
Definitely seeming aligned with the trend but what do you think will be needed in order for this downtrend to be reversed?
Some good old fashioned capitulation. If we break $5,750 support then the fear will set in and people will start panic selling into strong support. Then we will get a volume spike which will mark the bottom. The other option would be to continue to range between $5,750 . - $7,000 for another 6+ months.
Coins mentioned in post: