
I believe that it is possible to beat the market through a consistent and unemotional approach. This is primarily achieved through preparing instead of reacting. Click here to learn more about the indicators I use below and click here from my comprehensive trading strategy. Please be advised that I swing trade and will often hold onto a position for > 1 month. What you do with your $ is your business, what I do with my $ is my business.
My most recent Bitcoin Bubble Comparison led to the following predictions: 1 day - 28 days = < $5,750 | bottom prediction: $2,860 by 10/30
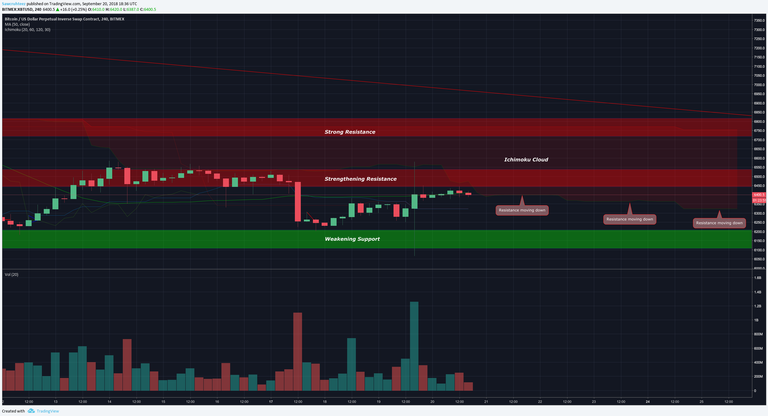
Previous analysis / position: Outlined a short entry at $6,490 - $6,525 with a stop loss at $6,601 / Short ETH:BTC from 0.03143 | Short ETH:USD from $211.96 | Short EOS:ETH from 0.0252326
Patterns: Descending triangle / Head and shoulders
Horizontal support and resistance: $6,382 support being tested right now | $6,425 acted as resistance
BTCUSDSHORTS: Shooting star just got confirmed, resistance at ATH’
Funding Rates: Longs pay shorts 0.0005%
12 & 26 EMA’s (calculate % difference): 12 EMA acting as resistance | 26 = -2.29%
50 & 128 MA’s: 50 = -3.41% | 128 = -7.73%
Volume: Large volume from squeeze yesterday
FIB’s: 0.786 = $6,377 | 0.886 = $6,248 | 1.618 = $5,330
Candlestick analysis: Currently forming a doji/shooting star
Ichimoku Cloud: 4h cloud has acted as strong resistance and currently waits just above the price. As we move forward the resistance from the cloud is gradually moving down.
TD Sequential: Daily R4
Visible Range: Testing point of control with 1m - 12m lookback
BTC Price Spreadsheet: 12h: - | 24h: +0.93% | 1w: -1.38% | 2w: - | 1m: -1.38%
Bollinger Bands: Expect a return to the bottom band at $5,800 after getting rejected from MA. BBW% still shows room for continued consolidation.
Trendline: Top end of descending triangle is at ~$6,800
Daily Trend: Chop
Fractals: Up has $6,555 did not break on last pump (yet) | Down at $6,050
On Balance Volume: Daily broke through resistance for a slight bull div. Weekly starting to turn over for a slight bear div.
ADX: Indicates trendless market
Chaikin Money Flow: Bear div on daily.
RSI (30 setting): W: 48.81 | D: 46
Stoch: %D diverging from %K after making bullish re cross.
Summary: That market continues to consolidate and the trading range continues to tighten. This is when it is very easy to get lulled to sleep by the lack of volatility, when in fact it is the most important time to stay alert.
The biggest moves happen after prolonged consolidation and if you aren’t prepared then the market will leave you behind. Now is the time to watch the charts like a hawk and patiently wait for an entry, if you are not already positioned.
Keep an eye on the daily candle. If it closes below $6,392 then it would create a shooting star and that could be a good time to enter. $210 has been holding as resistance for ETH and selling that area has worked out well over the last couple days. However, it has recently broken through it’s 7 week down trend and that is a reason to proceed with extreme caution. If it finds support above $207 on this current pullback then it will likely take out $210 and be on it’s way for a $225 retest.
Shorting EOS still looks like a great option to me. I have an order set to short at 0.0007474. Click here to read that analysis.
I am going out of town tomorrow from a camping and golfing trip and it is not very likely that I will be able to post another daily update until Sunday the 23rd.
Thanks for reading!

Allow me to Reintroduce Myself...
Learn How to Trade! [part 1]
Learn How to Trade! [part 2]
Wyckoff Distribution
Bitcoin Bubble Comparison
The Most Overvalued Coin in Crypto: EOS
Bitcoin Daily Update (day 204)
Coins mentioned in post: