
I believe that it is possible to beat the market through a consistent and unemotional approach. This is primarily achieved through preparing instead of reacting. Click here to learn more about the indicators I use below and click here from my comprehensive trading strategy. Please be advised that I swing trade and will often hold onto a position for > 1 month. What you do with your $ is your business, what I do with my $ is my business.
My most recent Bitcoin Bubble Comparison led to the following predictions: 1 day - 28 days = < $5,750 | bottom prediction: $2,860 by 10/30
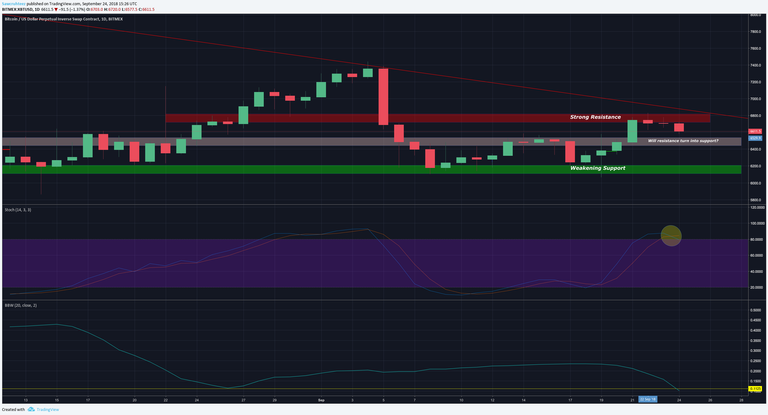
Previous analysis / position: “I am going to continue to wait on the sidelines for further development. I will be watching for the price to retest prior resistance for support at $6,560 and see what happens from there.” / Sidelines
Patterns: Descending triangle
Horizontal support and resistance: S: $6,550 | Will price resist $6,800 and/or create lower high or will it create a higher high?
BTCUSDSHORTS: Back down to 27,439 which is not far from support
Funding Rates: Longs pay shorts 0.011%
12 & 26 EMA’s (calculate % difference): 12: +0.007% | 26: Being tested for support | Will we get a bullish crossover?
50 & 128 MA’s: Brokethrough 50 MA and is finding support from it | 128: -3.91% | Price is being squeezed in between the two, will it get a golden cross?
Volume: Unimpressed by volume behind this recent pump.
FIB’s: 0.618: $6,611 | 0.5: $6,763 | 0.382: $6,916
Candlestick analysis: Doji and bearish spinning top have been confirmed
Ichimoku Cloud: Daily cloud held as resistance. Price tried to break back into 12h cloud but has since fallen out of it. Top of 4h cloud held as resistance. All clouds are bearish except for 1h which recently had a bearish TK cross and has re entered the cloud. It illustrates $6,444 as major level of support.
TD Sequential: Weekly price flip following G2 > G1| Daily G4 | 12h R3 | 4h R7 (R9 should provide a bounce and it will be very important if it creates a higher high or a lower high)
Visible Range: Remains in high liquidity area. Should be significant supply and the demand seems to be waning.
BTC Price Spreadsheet: 12h: -1.44% | 24h: -1.01% | 1w: +5.89% | 2w: +5.3% | 1m: +1.45%
Bollinger Bands: MA at $6,487 should get retested after pulling back from top band. Tightest the daily bands have been since April of 2017. Tightest we have seen the weekly bands since Dec 2016.
Trendline: Top of descending triangle = $7,044
Daily Trend: Bearish
Fractals: Up: $7,400 | Down: $6,098
On Balance Volume: Bull div on weekly.
ADX: ADX is nearing all time lows which indicates that the chop should be coming to an end soon.
Chaikin Money Flow: Bear div on daily as CMF continues to make lower highs and lower lows.
RSI (30 setting): W: 49.13 | D: 48.7
Stoch: Daily sell signal
Summary: All signs are pointing to a huge move being on the horizon. The Bollinger Band super squeeze that is occuring is a very strong indicator of upcoming volatility. The ADX nearing all time lows provides confirmation.
A move is coming, but there is no way to be sure which direction it will go. Therefore it is best to be prepared for both outcomes. If the price breaks out of the triangle (on volume), creates the first higher high of 2018 and breaks through the daily cloud then it will be time to enter a large long position.
However, there is one reason why I do not believe that will happen and it is the overall sentiment on Trading View and Twitter. If this was the end of a bear market then the majority would be calling this a dead cat bounce. Instead the majority still seem confident that the bottom is in and that it is time to accumulate.
The bottom is found when there is overwhelming fear, doubt and uncertainty. The bottom does not usually come it when the majority of market participants remain bullish. That is why I will be confidently looking for a short position to enter.
These next couple days should be very telling. The current pullback should bring us to $6,444 - $6,550 and what happens from there will be extremely important. If the bounce creates a lower high below $6,835 then it will be a tremendous shorting opportunity. If it does create a higher high then it will test the top end of the descending triangle at $7,000. I would view that as another great shorting opportunity due to being able to set a very tight stop loss which would likely provide a > 10:1 risk:reward ratio.
ETHUSDLONGS have entered extremely overbought conditions and are over 2X greater than prior all time highs. That could fuel the most epic squeeze crypto has ever seen and could likely be the catalyst for the next drawdown in the markets.
Thanks for reading!
Allow me to Reintroduce Myself...
Learn How to Trade! [part 1]
Learn How to Trade! [part 2]
Wyckoff Distribution
Bitcoin Bubble Comparison
The Most Overvalued Coin in Crypto: EOS
Bitcoin Daily Update (day 206)
You have a minor misspelling in the following sentence:
It should be occurring instead of occuring.Interesting thoughts which I agree with regarding the sentiment and bullishness related also to volumes being lackluster. Also, I thought overbought conditions like ETH could persist given the prior oversold conditions... Will be interesting to see how it plays out!
Congratulations @sawcruhteez! You received a personal award!
Click here to view your Board
Congratulations @sawcruhteez! You received a personal award!
You can view your badges on your Steem Board and compare to others on the Steem Ranking
Vote for @Steemitboard as a witness to get one more award and increased upvotes!