Disclaimer: This is not meant as financial advice and is for entertainment purposes only.
Extra Disclaimer: I just returned from my good friends birthday party and am well above the legal limit.
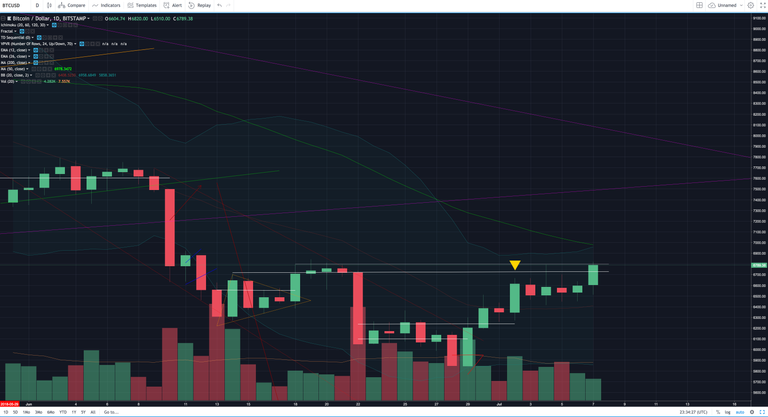
I have been drinking and my analysis should be taken with a grain of salt. Long story short - resistance at $6,725 has failed to push the price below $6,390 and we are primed for another $750 - $1,000 pump.
Short story long, there is a lot of resistance built up but it isn’t enough at this level. We are too far oversold on the higher time frames to continue dropping further. There is a C-Clamp on the daily and 3 day chart that needs to be rectified and we are too far below the 50 & 200 period MA’s to sustain this drop.
A pump to $7,500 is expected but it is not something to bet on. We are deep in the trenches of a bear market and preparing for a short sale entry should be the priority. As outlined in the last few posts building at short at or above $7,500 is very attractive.
To make up for the short post see my checklist below:
Horizontal support and resistance: S: $6,508 R: $6,620
BTCUSDSHORTS: turning s into r. Still inside triangle.
Funding Rates: 0.01%
EMA’s (12 & 26): 1d: posturing for bullish cross 4h: crossed at $6K , flattening out and could posture down soon
MA crossovers: bearish
Candlestick analysis: tweezer bottom on daily, and higher lows. Looks like it is cupping around bearish spinning top .
Chart Patterns: head and shoulders could be forming
Ichimoku Cloud: tenkan resistance on 4h. At cloud resistance on 12h. C clamps on daily and 3d.
TD Sequential: 3d: Green 2 1d: Green 1
Visible Range: Mad resistance and unfilled gap at $5,000
50 & 200 MA’s: below 50 & 200 and both are posturing down
BTC Price Spreadsheet:
Bollinger Bands: 1d: consolidating above MA 3d: bouncing off bottom band 1w: bouncing off bottom band
Trendline: waiting slightly under $5k
Fractals: up: $6,800 down: $5,819
On Balance Volume: bear divs w lower high and lower low vs tweezer . Bouncing on weekly
Buy/Sell Sentiment on Trading View: RSI < 50 Stoch overbought
Yesterday’s analysis: TD 8, weekly dragonfly, bitfinex channel, visible range
Thanks for reading! Have something to say? Leave a comment! Smash the follow so that you don’t miss out on future updates and remember that clicking the like is good karma!

After content like that you know you want more!
Yesterday's Post - Day 131
Trading Challenge - Day 117
Weekly Gold Update - Week 15
School - Options 101: Limited Risk with Unlimited Reward | Intermediate Trading Strategy | White Paper Cliff Notes: AION | Intro to Indicators: Stochastic | Bitcoin Market Cycle
Need a break? Read some Poetry! - I Believe | Aliens | The Universe is a Hologram | Sunset
Great review keep it updated
Source
Hello,
There is no response to the verification request on a previous post.
We recommend you verify your identity or content ownership as soon as possible. Failure to do so could reuslit in your account being add to @cheetah's blacklist. You can contact a member of our team on Discord
Thank You,
More Info: Introducing Identity/Content Verification Reporting & Lookup &
Identity & Content Verification Guide: When to Ask and When Not To